Hi,
My scenario - all on the same chart region (Combination Chart) -
- I have a bar chart series that should display data at a grouping (label) of monthyyyy, product
- I have line series (markers displayed only) on the same chart that should display data at a grouping (label) of monthyyyy, product
- I have another line series (summarised value per month) on the same chart that should display data as a grouping (label) of just monthyyyy
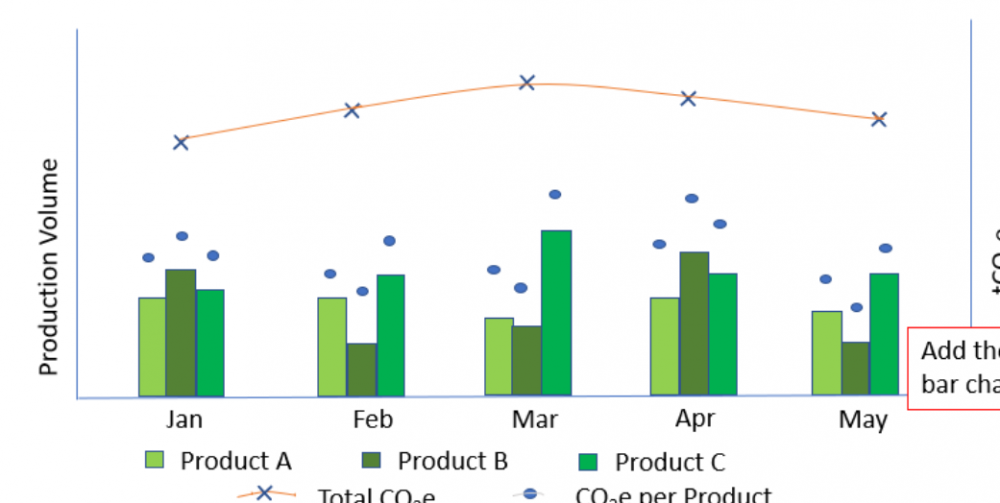
I can get 1 and 2 to work together (using hierarchical labelling) but as soon as I try and add in 3 I get an issue with the labels on x-axis - the labels for option 3 are added to the end of the x-axis rather than overlayed with the ones from options 1 and 2.
My question is this. Is there a way of using more than one level of grouping (labels) on the same chart region?
Many Thanks