Hi @all,
i need to create a stacked bar chart. I use the D3 Bar Chart plugin, that is used in the sample APEX app from oracle.
My test table is as follows:
create table report(
line varchar2(100),
serie varchar2(100),
count number);
insert into report values ('Line A', 'Serie 1', 12);
insert into report values ('Line A', 'Serie 2', 14);
insert into report values ('Line A', 'Serie 3', 16);
insert into report values ('Line B', 'Serie 1', 18);
insert into report values ('Line B', 'Serie 2', 20);
insert into report values ('Line C', 'Serie 3', 22);
My simple stmt for creating the chart is like:
select line, serie, count from report;
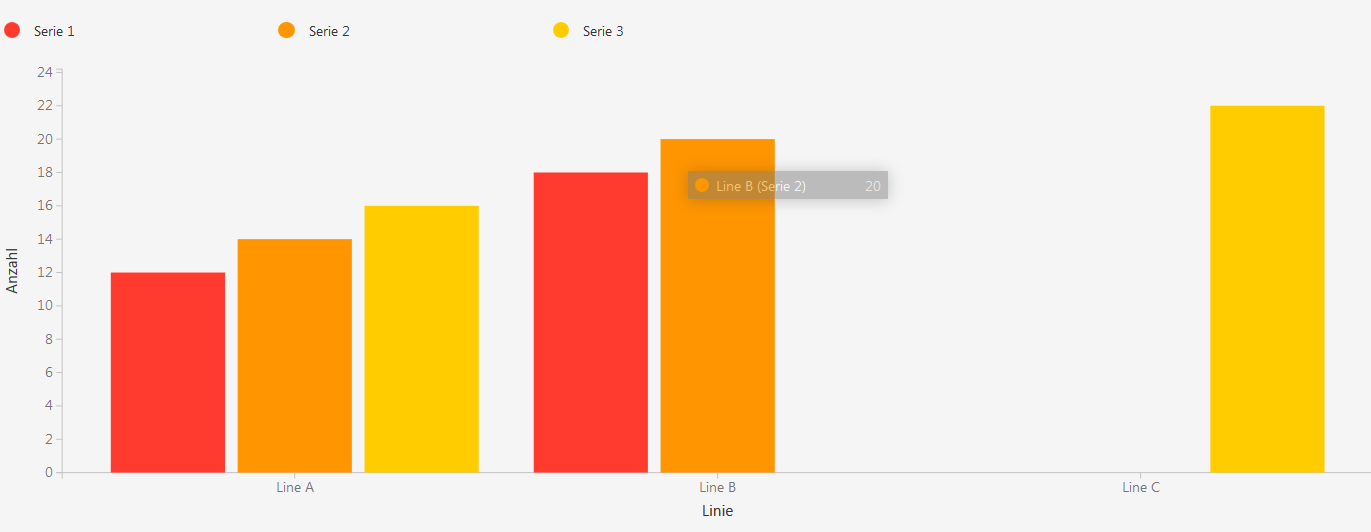
The following test works then fine:
Under chart attributes i set following values:
x-values column: LINE
y-values column: COUNT
display: vertical, side by side
multiple series: enabled
series column: SERIE
I get a chart as i want!
BUT If i switch the display attribute to 'vertical, stacked', then the chart has error in Line C.
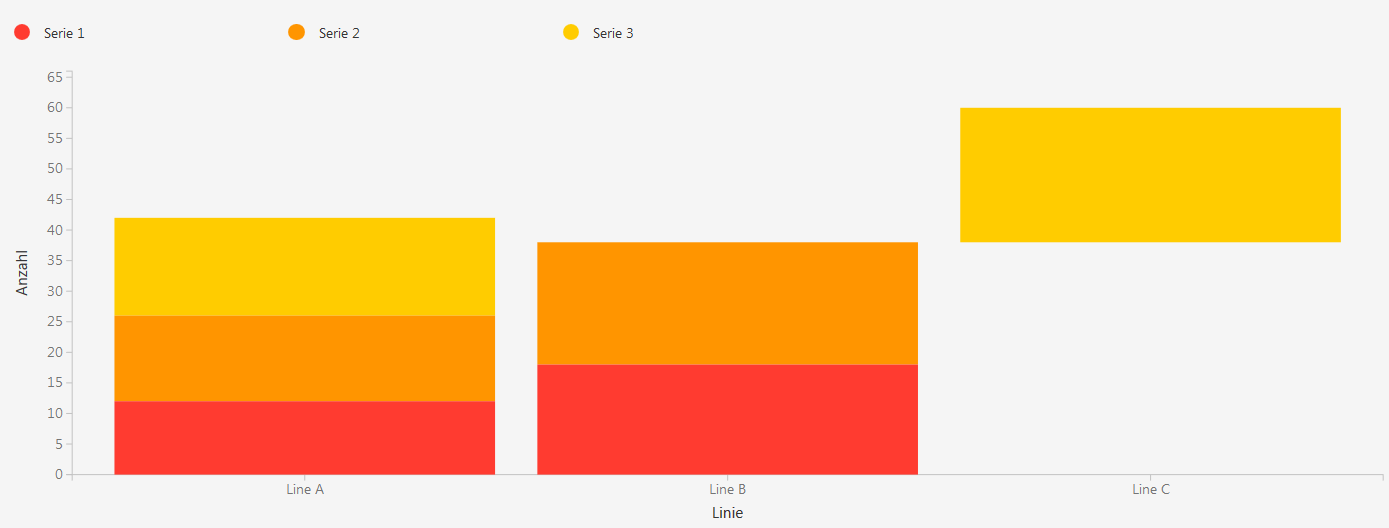
The yellow bar should be between 0 and 22 and not between 38 and 60. It seems, that this is a bug, nor?
I'm using APEX 5.0.1.00.06 and Oracle 11.2.0.1 on Windows 64.
For my own report, that has some grouping functionality, i don't get any chart with stacked display.
I have exported the D3 bar chart plugin from the sample application and import it into my own application.
regards
Maik