Dear Gurus,
I am using the latest on-prem OBIEE 12c (12.2.1.4)
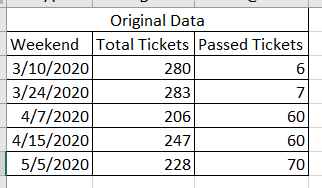
I am trying to create a simple Weekly report with Weekend and Distinct Count of tickets; where the dates are not continuous, meaning the week-ends are skipping a few in between (like: Weekend is 4th April, then next data is for 25th April skipping intermediate weeks of 11 and 18).
The user wants to see data for all weeks in a continuous manner with incremental values getting added to current week.
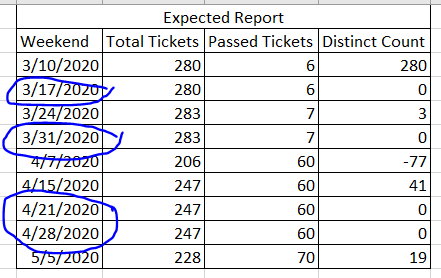
In normal report, RSUM was not working, so I referred to OBIEE 12C: RSUM Is Not Working on Column with Null values (Doc ID 2389093.1), which again needed some changes. I had to revert my physical formula for RSUM to just count and use "Display as Running Sum" from Results section.
I am getting the expected result now.
However, when I am trying to create a simple Line chart with X as Weekend and Y as Total Count, it is just taking the dates present in my original data and NOT the output of Running Sum.
1. Please help me understand how can I create Reports on the RSUM data?
2. I need to create a Delta Report, which will display what has changed between current week and last week.
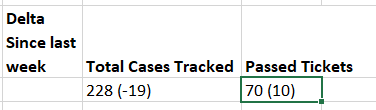
where Delta is Current Week - Last Week. Please help me understand how can I take the current and last week from the RSUM Output.
Regards,
SonPat