I have clustered a data-set to 3 clusters using k-means algorithm but i can't find a way to display the clusters in a scatter plot, This is my model data
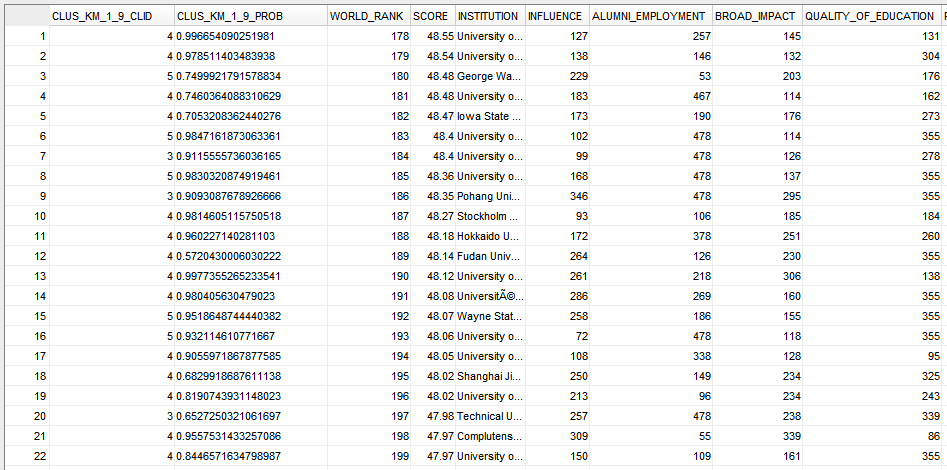
Here you can see Clusters ID's and probability values, But i want to display this PROB values in a scatter plot which shows clusters
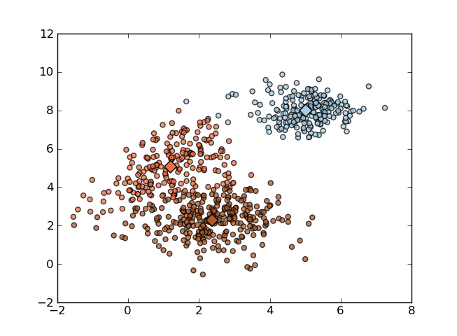
The clusters should be look like this but i can't find x and y coordinates for cluster values? what should be the x-axis and y-axis how to denote?