Skip to Main Content

Analytics Software

Announcement

For appeals, questions and feedback about Oracle Forums, please email oracle-forums-moderators_us@oracle.com. Technical questions should be asked in the appropriate category. Thank you!

Charts in OBIEE does not display Values on X-Axis

User_KJI1ONov 22 2016 — edited Nov 23 2016

Hi All

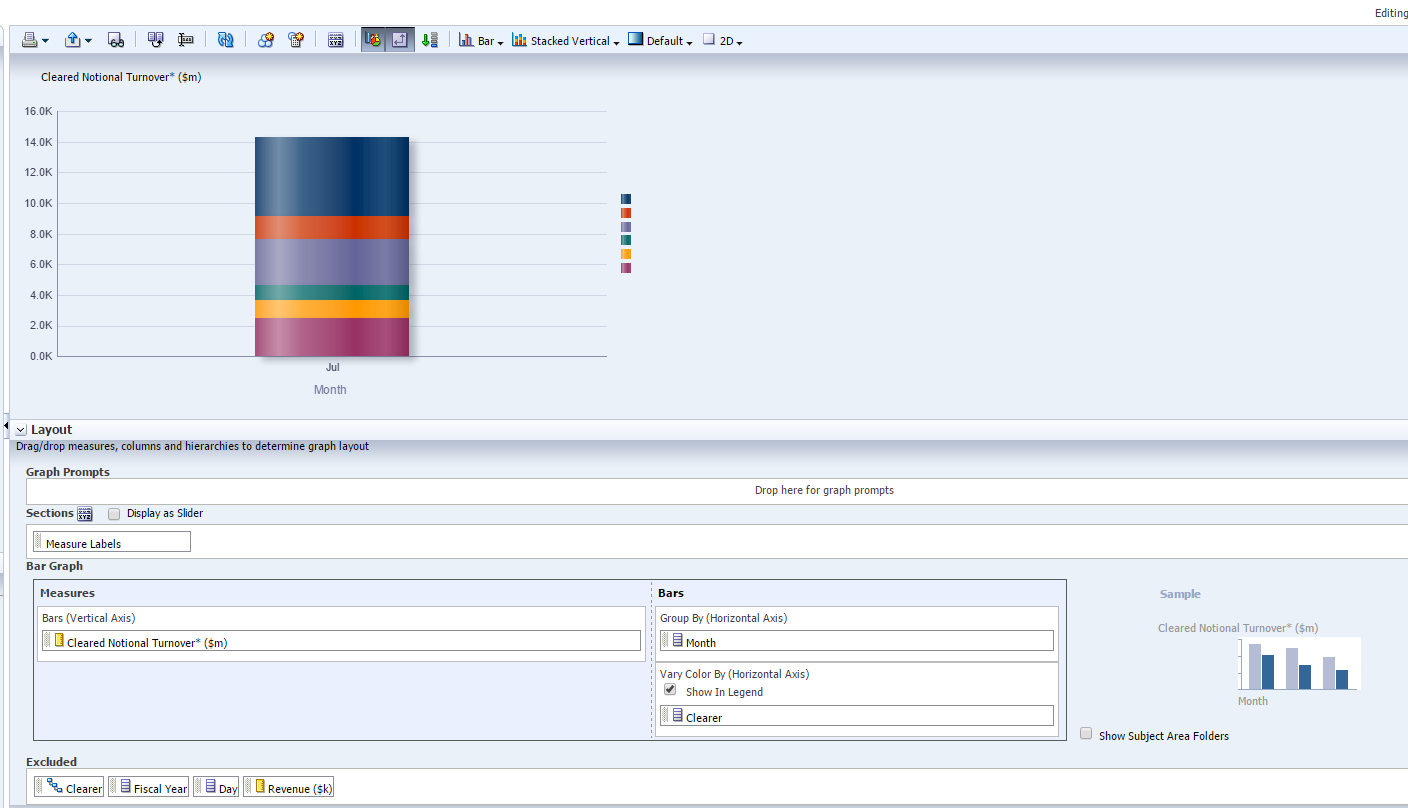
I have created a chart which groups the values by days. I have tried all options possible but for Days I am not getting values on X-Axis. I have tried to filter the chart only for 2 days thinking it may be too much data but it still does not show anything. Below screenshot shows the Group By Day.

pastedImage_0.png

Now if I change from Day to Month it works fine. Any idea what could be happening?

pastedImage_1.png

Thanks in Advance.

This post has been answered by User_KJI1O on Nov 23 2016
Jump to Answer
Comments
Locked Post
New comments cannot be posted to this locked post.
Post Details