Hello,
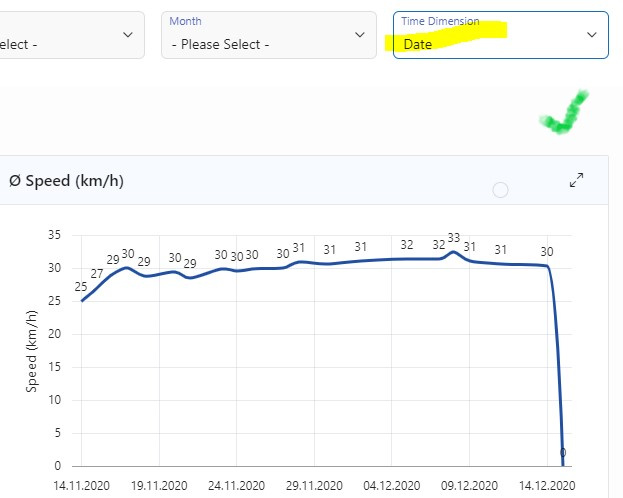
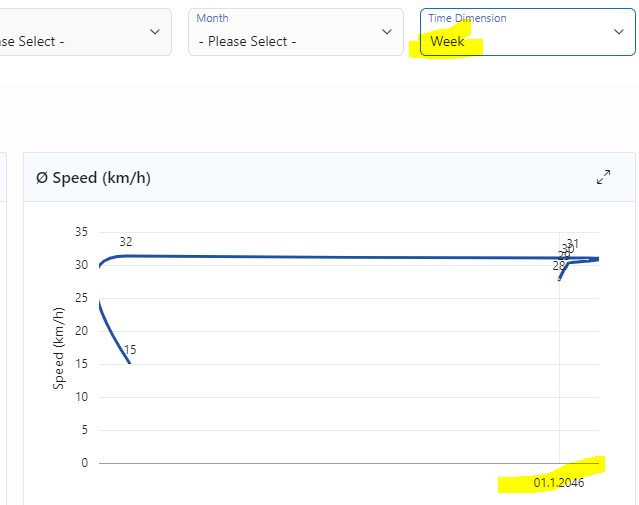
I have a chart with a dynamic time dimension meaning that the user can select "date" or "week".
When "date" is used and time axis time enabled and format is set date short then evrything is fine but when
"week" is used the chart and label on x axis looks wired.
So is there a way to dynamically change the time axis type and format for the x axis via javascript?
Thanks and regards,
Hendrik

