Hello, I am currently working with graphic reports and I find myself with the problem that some graphics cannot be manipulated.
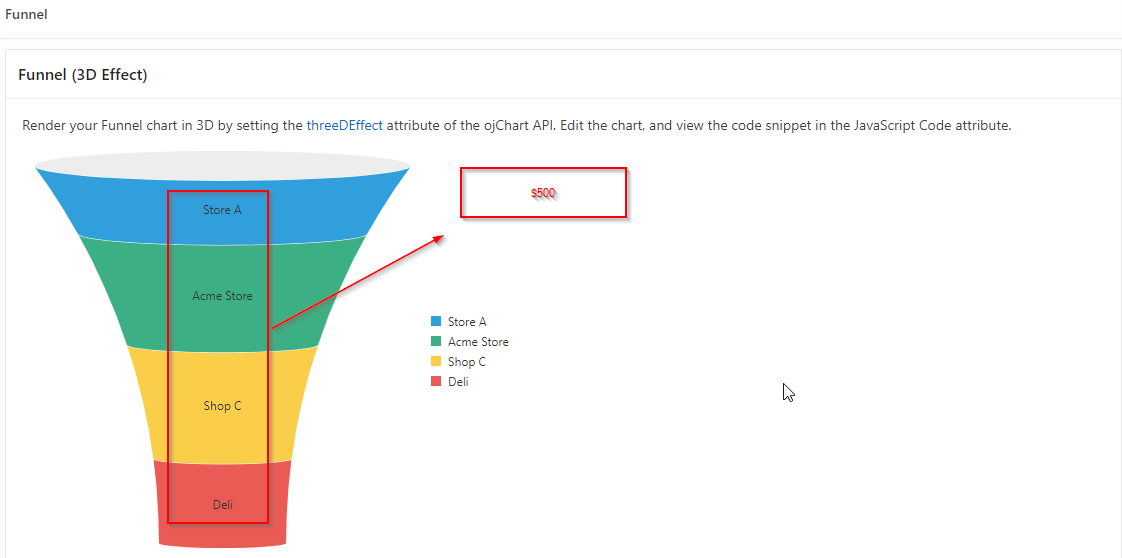
For example, the funnel graph, instead of displaying the series names, I would like to see only the totals (value) and I could assign them an order and color.
Is there a way to do it?
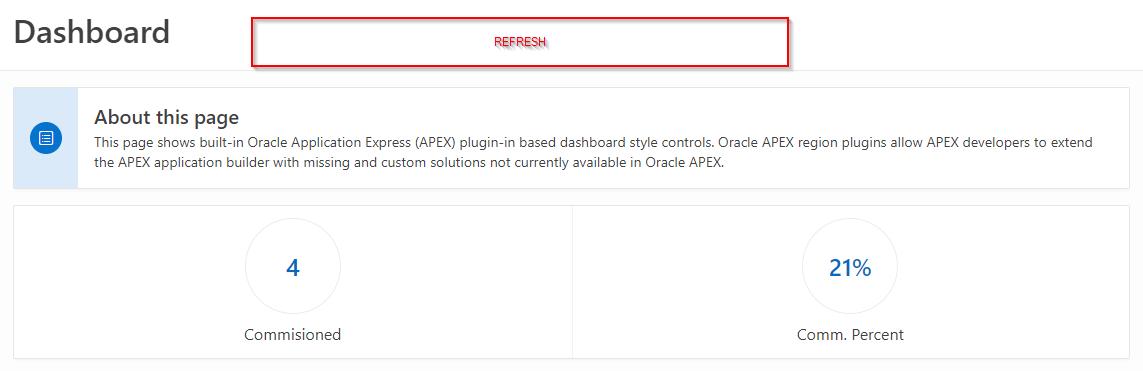
In these last two graphs I would like to add a refresh, I am using <meta http-equiv = "refresh" content = "15"> but it updates the entire report screen and I only need the graph to be updated.
I hope you can help me. Thank you very much!!