I have a bar chart with the average runtime of jobs that are being run in the system sorted in descending order. I am looking for a way to have the user click on each bar that takes them to a detailed report of that specific job. How can it be made possible?
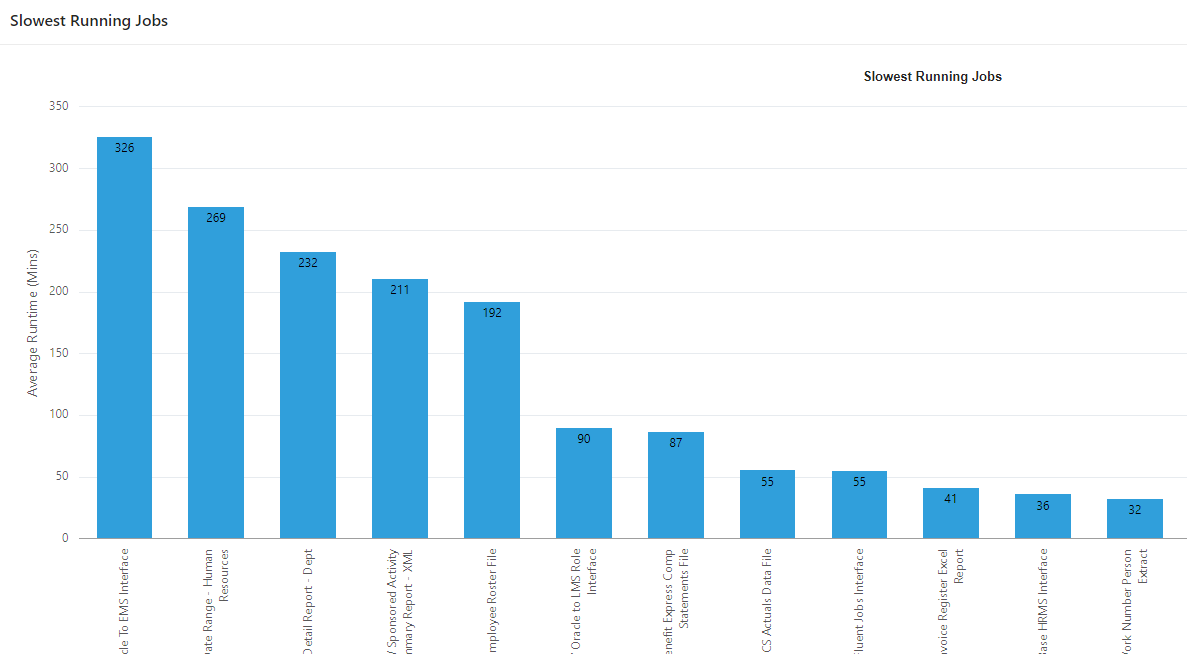
I see there is a link option in the chart under the series tab, but this is for the entire chart and not specific to one bar plot. Let me know how can I accomplish this.