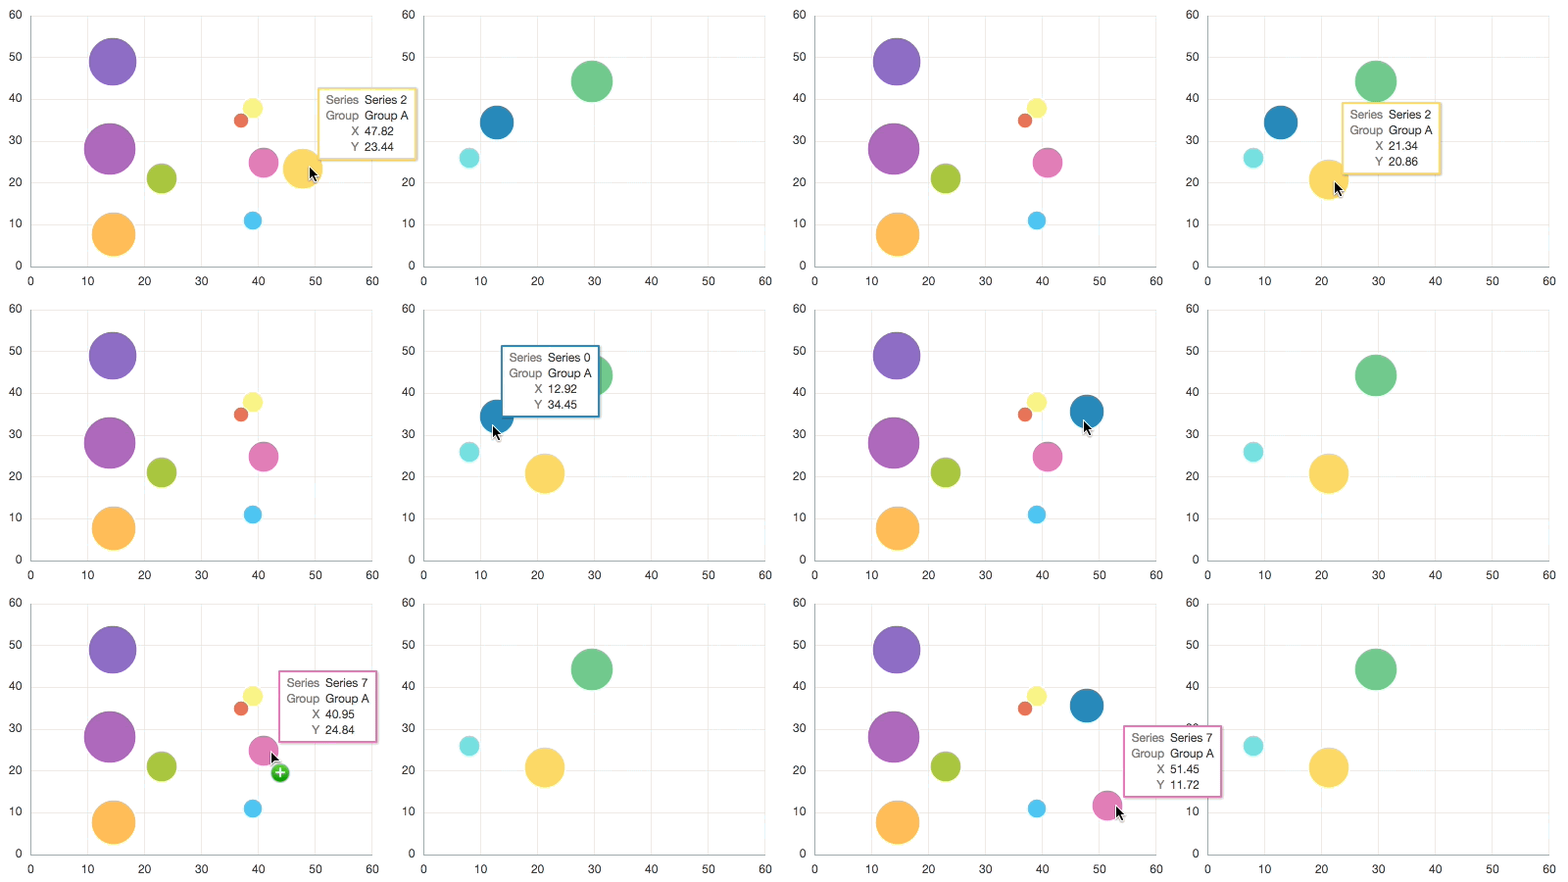
Drag and drop is a new ojChart feature that was introduced in JET 2.0.2. In addition to dragging between charts, this feature also supports dragging to and from other components. Similar to the other JET components, it is built using the HTML5 drag and drop.

ojChart supports dragging of data items (i.e. bars, bubbles, etc.), series objects (i.e. legend items), and group objects (i.e. categorical axis labels). To set up a chart as a drag source, you only need to set the dataTypes attribute of either items, series, or groups option inside dnd.drag. The dataTypes are the MIME types to use for the data context JSON in the dataTransfer object. The chart objects (items, series, or groups) with the dataTypes specified will automatically become draggable.
HTML:
<div id="bubbleChart1" data-bind="ojComponent: {
component: 'ojChart',

type: 'bubble',

series: bubbleSeries,

groups: bubbleGroups,

dnd: {

  drag: {

    items: {

      dataTypes: \['text/bubblechart'\]

    }

  }

}
}">
</div>
The chart will automatically populate the dataTransfer object with the data context JSON of the dragged items using dataTransfer.setData() method. You can retrieve the JSON using dataTransfer.getData() method. Here's an example of how the data context JSON may look like for a bubble chart item:
[
{
id: 'Series 1; Group B'

series: 'Series 1',

group: 'Group B',

x: 40,

y: 24,

z: 12,

seriesData: {...},

groupData: \[...\],

data: {...}
}
]
ojChart also supports dropping onto its plot area, legend, and axes. To set up a chart as a drop target, you only need to specify the drop callback and the dataTypes for either plotArea, legend, xAxis, or yAxis option inside dnd.drop. If the dataTypes in the dataTransfer matches the specified dataTypes in chart option, then the chart will accept the drop.
HTML:
<div id="bubbleChart2" data-bind="ojComponent: {
component: 'ojChart',

type: 'bubble',

series: bubbleSeries,

groups: bubbleGroups,

dnd: {

  drop: {

    plotArea: {

      dataTypes: \['text/bubblechart'\],

      drop: dropCallback

    }

  }

}
}">
</div>
JS:
this.dropCallback = function (event, ui) {
var data = event.dataTransfer.getData("text/bubblechart");
if (data) {
var dataContext = JSON.parse(data)\[0\];

// Update the chart to react to the drop

...
}
};
In the future releases of JET, we will also expose the drag and drop features for other data visualization components.
For more information and demos, please visit the following JET Cookbook pages:
For complete API documentation, please visit the JET JSDoc.