Hi everyone,
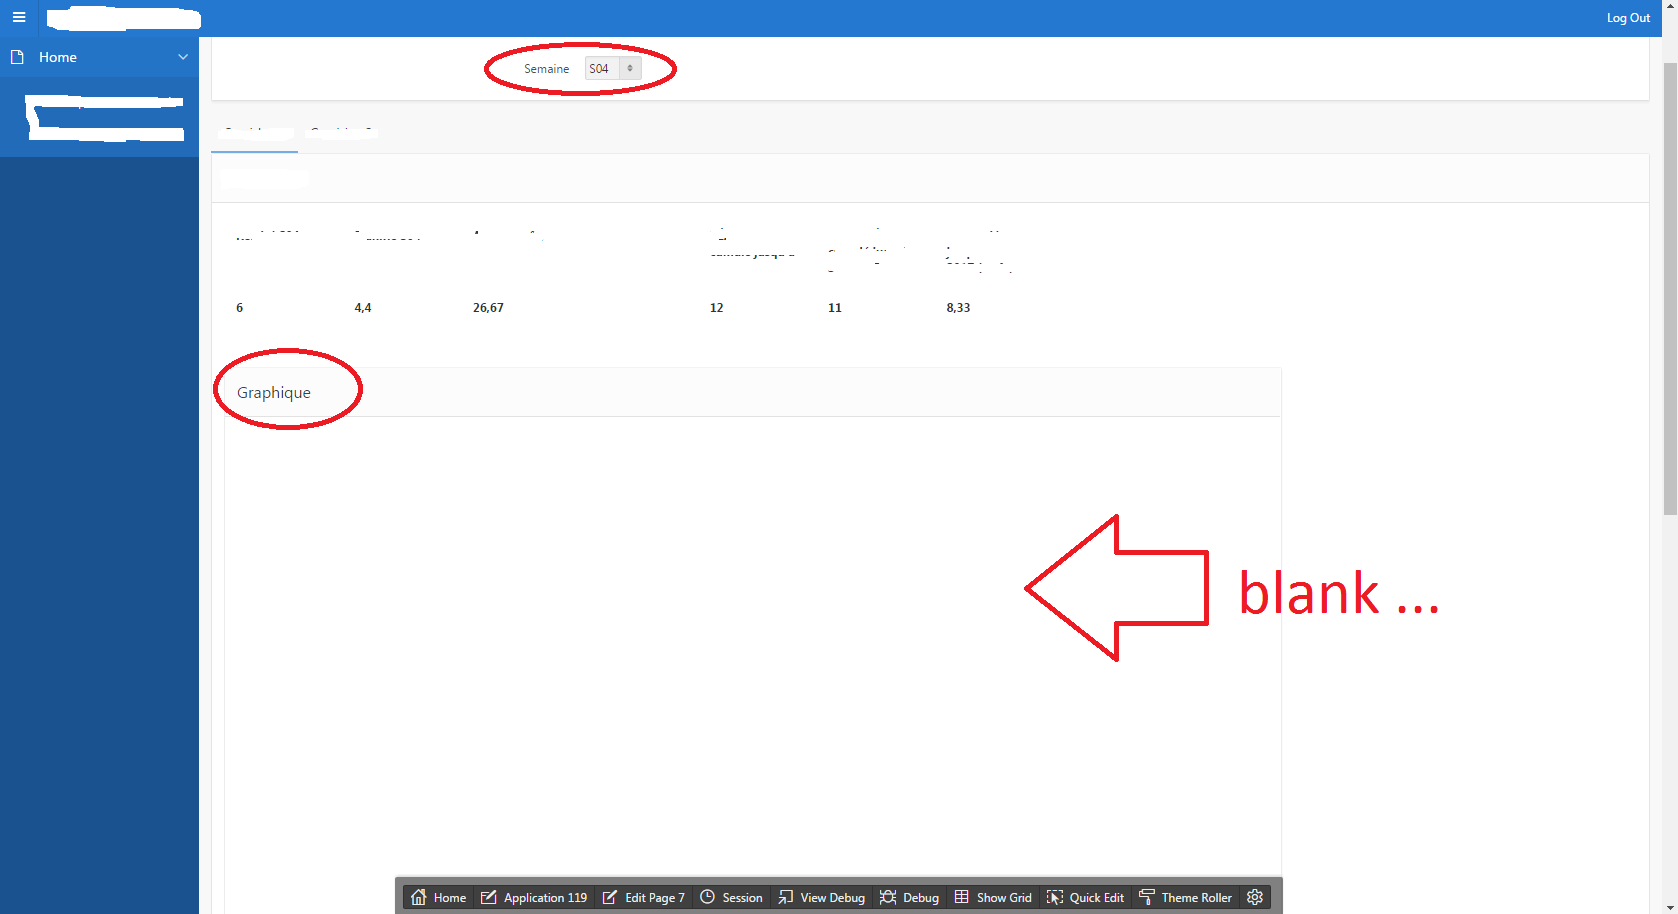
I've just created a chart showing some sample data depending on a list of values and at first it works. But then, when I select another data from the list, the chart is blank instead of showing the new data. There isn't even any of the axis.
Can anyone help please ?
Thanks in advance.