Hi Guys,
I am having some issues controlling the size and gaps between bars on Bar Charts.
Here is an example from the cook book:
http://www.oracle.com/webfolder/technetwork/jet/jetCookbook.html?component=barChart&demo=attrGroups
I removed 3 columns an i got this:
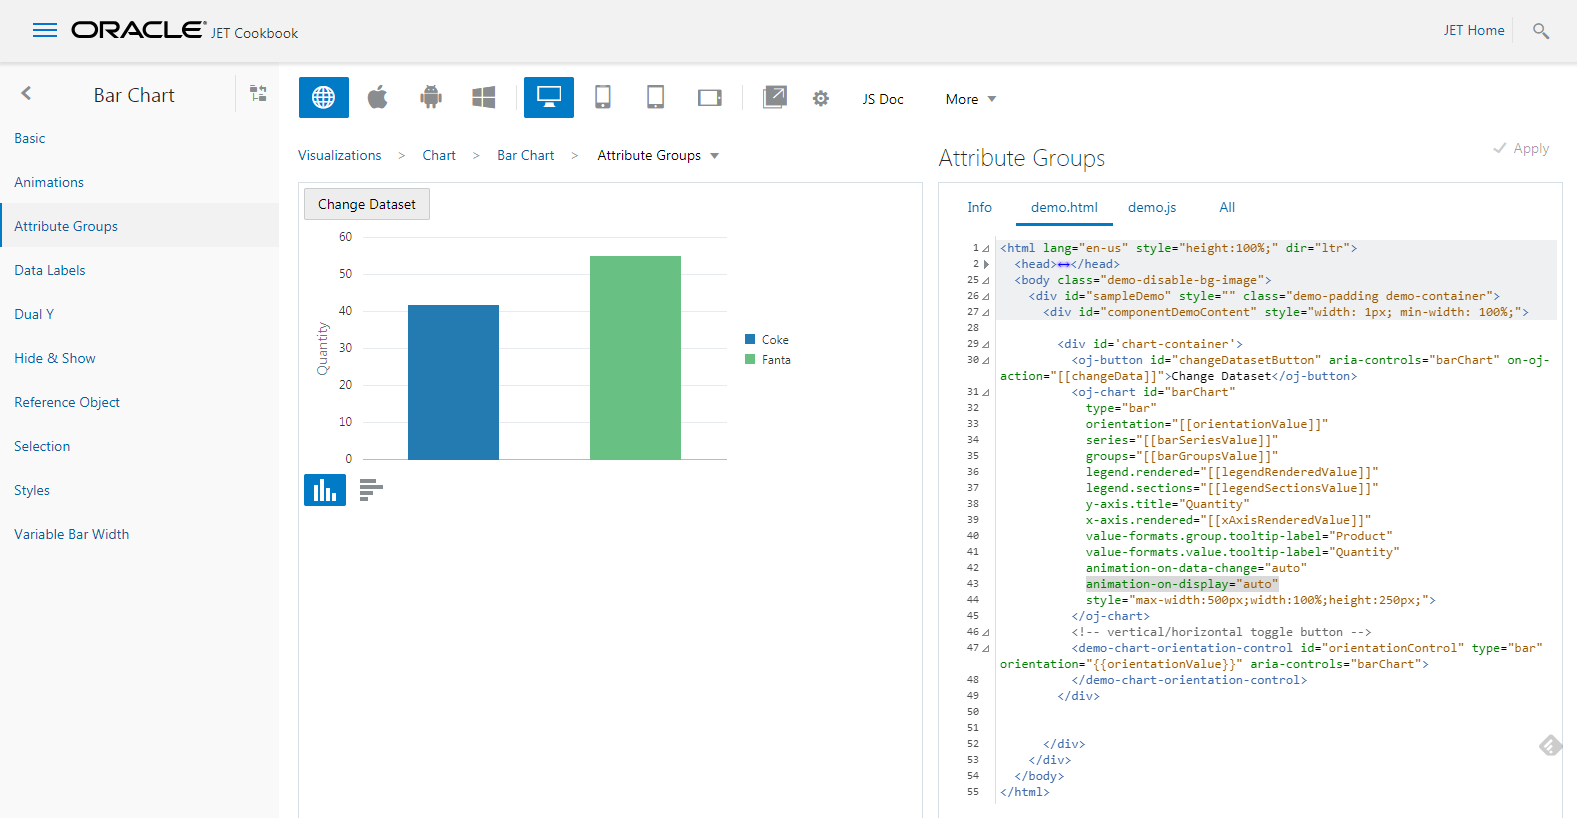
As we can see there is a big gap between the bars.
When i try to follow the example i see this:
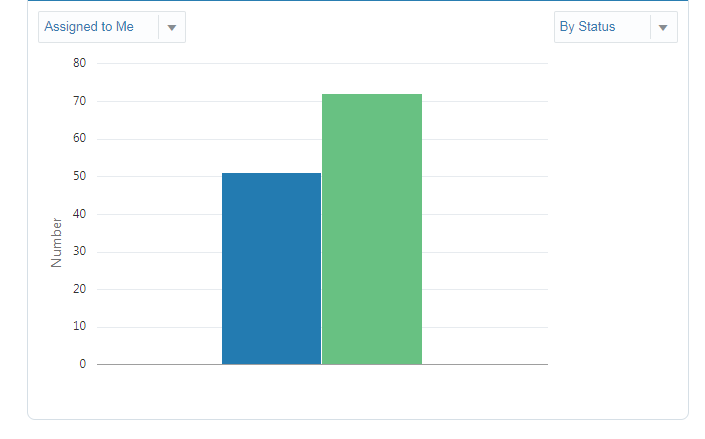
As we can see the bars are width are kind of the same size, but the gaps between on the bars on my chart are very small and i can't understand why.
By looking to the cookbook example, i don't see any specific setup to achieve that gap size. I could find an example where we can define the gaps between groups, but not bars.
Here is my html code of the chart:
<oj-chart id="myLeadsBarChart"
type="bar"
series="[[newLeadsDataSource]]"
groups="[[newLeadsGroupsValue]]"
animation-on-display="auto"
animation-on-data-change="auto"
y-axis.title="Number of Leads"
x-axis.rendered="on"
drilling="[[myLeadsChartDrillingValue]]"
on-oj-drill="[[myLeadsChartDrill]]"
selection-mode="none"
hover-behavior="dim"
legend.position="auto"
legend.rendered="off"
style-defaults.data-item-gaps="100%"
style-defaults.max-bar-width="100"
style="width:100%; height:350px;">
</oj-chart>
I tried to use the attribute style-defaults.data-item-gaps but with no success. The gaps on the chart remain the same very small.
On the cook book i do not see any attribute that suggest that it is controlling the size of the bars or the gaps.
Can someone explain me how the gaps of a Bar Chart and the Bar Sizes can be defined and controlled?
Thank you very much in advance