Hello,
I want to modify my BarGraph's bar size and plot area. Here is my current graph picture and code:
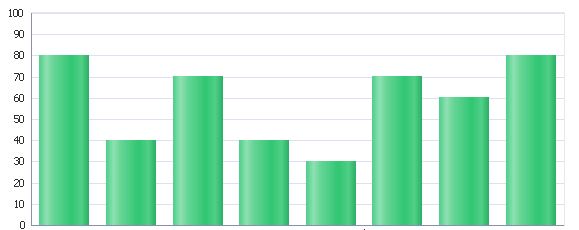
<dvt:barGraph subType="BAR_VERT_CLUST"
inlineStyle="height:245px;width:575px;"
tabularData="#{pageFlowScope.performanceDetailController.targetList}">
<dvt:graphPlotArea borderColor="#e7e7e8"
borderTransparent="false" fillColor="#ffffff"
fillTransparent="false" />
<dvt:series></dvt:series>
<dvt:seriesSet defaultColor="#33c572" barShape="RECTANGLE"
defaultMarkerColor="#00FF00">
<!-- <dvt:series lineStyle="LS_DOTTED"/>-->
</dvt:seriesSet>
<dvt:y1Axis axisMaxAutoScaled="false" axisMaxValue="100"
axisMinAutoScaled="false" axisMinValue="0"
majorIncrement="10" />
<dvt:x1Axis />
<dvt:legendArea rendered="false" />
</dvt:barGraph>
I'm trying to change the output something like this:
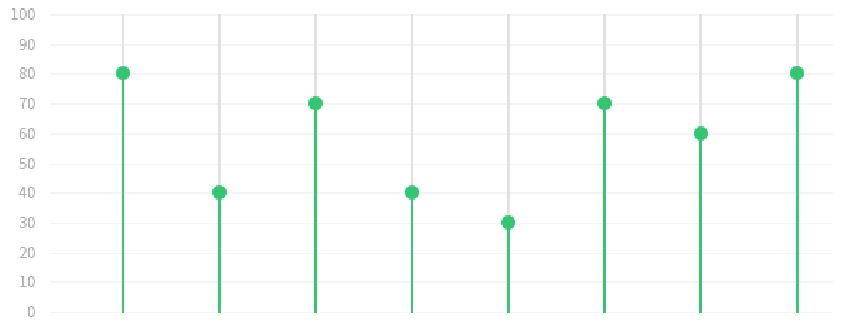
Is it possible to change the default bar size and plot area like in the picture above? Please share your thoughts with me about this issue. Thank you very much.