Hi All,
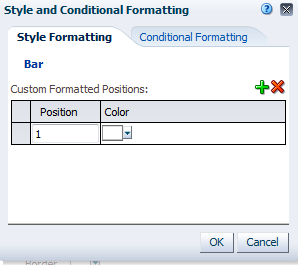
We need to change the colors of some bar charts to fulfill a requirement provided by our users. We have been able to satisfy the requirement for most of the charts. However, there are a few where our approach is not working - bar charts containing a graph prompt. The prompt only contains two values, and the requirement is to have a different color bar chart for each value. We have tried to use the graph properties > style tab > style and conditional formatting > style formatting tab. But, it only works on column positions. So, for example, we get the same thing for both values in the prompt.
Is there any way to have all columns in each bar chart display as different colors, when a different prompt is selected?
OBIEE 11.1.1.9.x (OBIA 11.1.1.10.1)
Regards,
Charles