Hi,
I try to get my formatting of the X-Axis correct in a line chart (Apex 18c) but I cant' get it to work. This is what I do. Take e.g. this query:
with nums as (
select rownum as rnum
from dual

connect by rownum \< 300)
select rnum as x, sin(2*rnum/30) as y
from nums;
Note that the X-Axis is numeric. This gives me this chart:

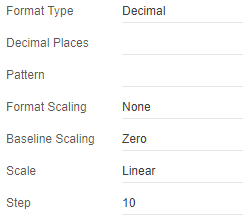
Problem: The X-Axis contains these 1,7,13,19,... values. I would like to have a more meaningful interval, like 5,10,15,20 or 10,20,30,40, not a step of the number 6. Also the values should not change when I resize the graph. My setting of "10" for "Step" does not seem to be taken (is that the setting to use?):
X-Axis:
Also the settings for major and minor ticks don't seem to be taken. :
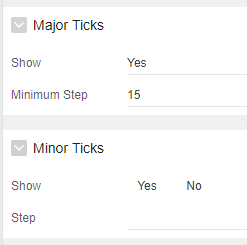
What exactly is the meaning of these step and tick settings, how to use them and how to obtain the result that I want (step interval of 5 or 10)?
Related to this, can I reduce the number of vertical grey lines in the graph? Now there are about 100 in the screenshot above. E.g. a thick line for the multiples of 20 and a narrow line for the multiples of 5 would be perfect for me. Can this be controlled? This looks to me what major an minor ticks are intended for, but as said, I can't get these settings to work. Also if I give e.g. "#°F" for pattern, as in the help text, nothing changes. So actually nothing really works for formatting this X-Axis, so what do I do wrong?
Thanks for your reply, either in words and images, either by providing a sample application that demonstrates all the correct settings to get my request done (but please ensure the X-Axis is numeric when you test this, not a date).
Regards,
Geert