Hello,
I was searching for a bullet graph in OBIEE 11.1.1.7 but I've seen nothing like this in the graph types nor in this forum.
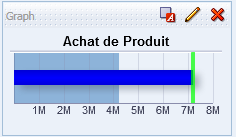
Until I realized after many tweaks of an horizontal graph that I could use properties of this graph type to achieve like a bullet graph.
You build an horizontal graph with one mesure then go to "Edit graph properties" > "Scale" tab > "Scale Markers" properties > I personnaly added one marker with a marker of type "Range:" with a "Low" = 0 and for "High" I selected my column of last year mesure and choosed a color. I added another marker with a marker of type "Line:" with a width = 4px and for "Position" I selected my column of budget mesure and choosed another color.
I attached a preview of what it looks like.

I hope it could help someone else.