Hello, everybody!
I am fresh to APEX development, and have a really nice question to the masters. I've sorted out standard report types in apex (thanks to the splendid curriculum), but still don't know what's the best way to solve our business issues.
So, let's imagine we have such a query:
select
 col1,

 col2,

 val1,

 val2,

 val3,

 val4,

 val5,

 val6,

 val7,

 val8,

 val9,

 val10,

 val11
from table(mega_function(city => ?, format => ?, percent => ?, days => ?));
And this query returns something like this:
| col1 | col2 | val1 | val2 | **val3
** | val4 | val5 | val6 | val7 | val8 | val9 | val10 | val11 |
| S1 | C1 | 28700 | 120 | 15:35:01 | 150 | 120 | 1500 | 1800 | 2700 | 60 | 28900 | 120 |
| S1 | C2 | 27000 | 240 | 14:44:23 | 0 | 1500 | 240 | 1200 | 25500 | 60 | null | null |
| S2 | C1 | 32000 | 120 | 15:38:28 | 1450 | 120 | 1500 | 1200 | 31000 | 120 | 32600 | 300 |
| ... | | | | | | | | | | | | |
So, as we can see, nothing difficult so far - there is a query from a pipelined funtion and there's a result set. So, the tricky part is that we need to show it in a matrix way with applying different styling techniques.
Something like this (clickable):https://drive.google.com/file/d/0B5nJc4UwogRSWDBtb2NBaGtDQms/view?usp=sharing
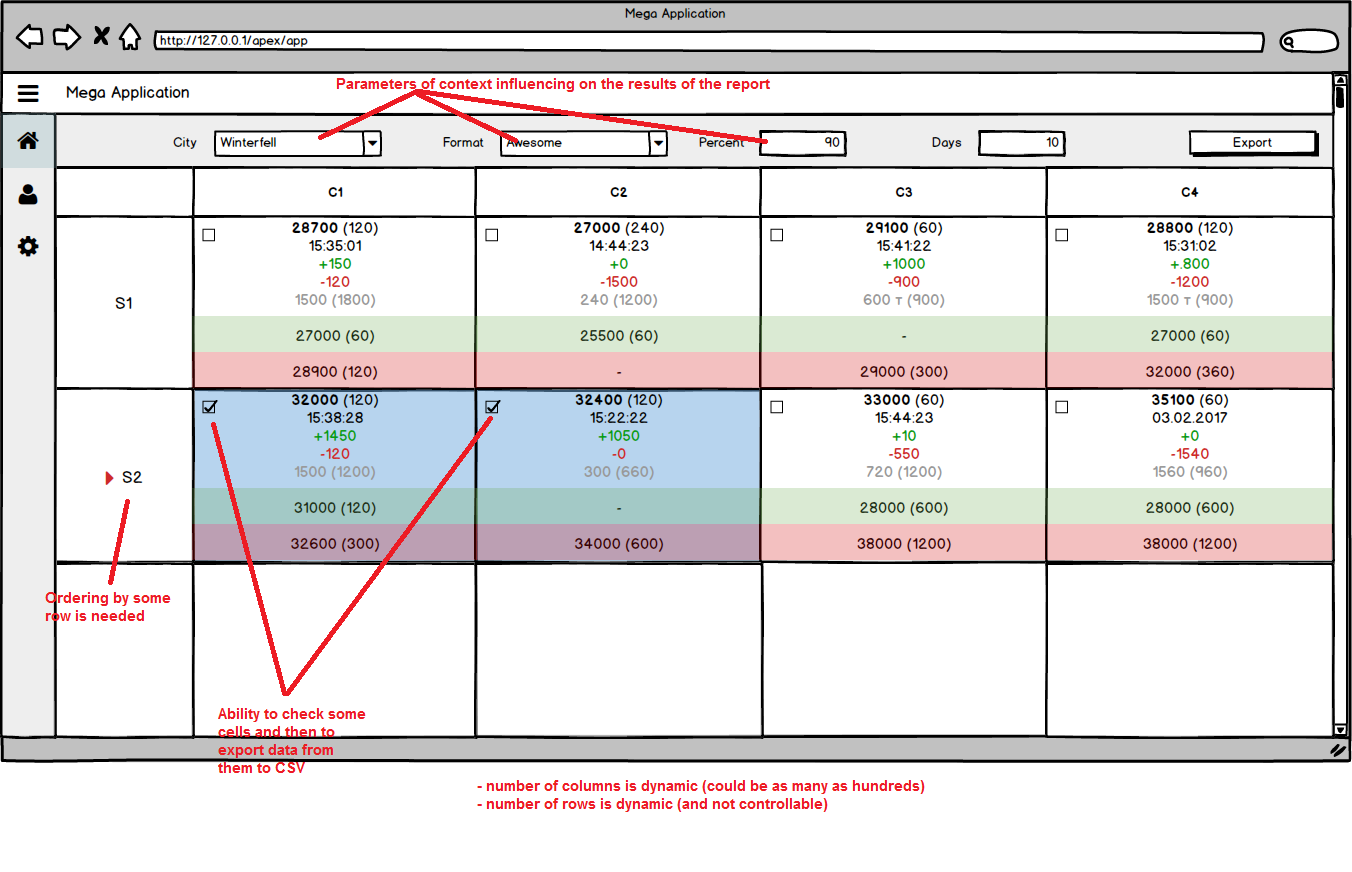
Number of columns and rows are dynamic as you can see (could be one column and could be 100, so to use a PIVOT query is not a way due to intransparency and low performance. So I'd prefer just to show (manipulate the data on the 'view' level) the data in a desired way.
What I understood so far, is that I'm able to complete my task using "Dynamic PL/SQL Content" Region with custom HTML markup using HTP and APEX API. But it doesn't seem the nicest and easiest way (a lot of HTML code, and I have no clue how to implement sortable rows using jQuery UI components).
So, maybe my task only seems not typical and difficult? Are there any better ways to achieve desired result? Classic report with a custom template? Plugin? Anything else?