Hello all,
While analysing a sql performance problem I oticed this difference:
For the same interval of time AWR is showing me different information than ASH regarding TOP sql execution
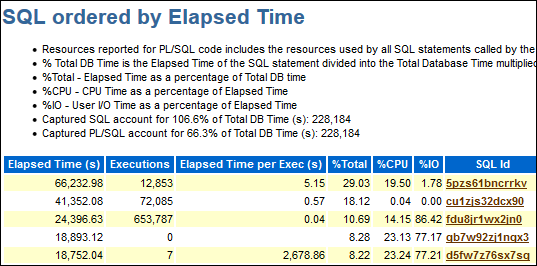
5pzs61bncrrkv is responsible for almost 30% of % DB activity and it's a call to a PL/SQL procedure:
BEGIN SI2.PCK_WEB_CLIENT_LCM.P_CREATE_NEXT_VRS_FRT_WRQST(:1 , :2 , :3 , :4 , :5 , :6 , :7 , :8 , :9 ); END;
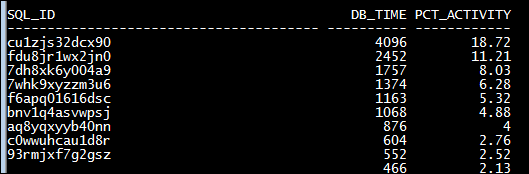
Querying directly dba_hist_active_sess_history , I cannot get 5pzs61bncrrkv SQL_ID in the top 10
select
\*
from (
select

   sql\_id,

   count(\*) as db\_time,

   round(count(\*)\*100/sum(count(\*)) over (), 2) as pct\_activity

from

   dba\_hist\_active\_sess\_history

where

   sample\_time between to\_date('19/09/2017  17:00:00','DD/MM/YYYY HH24:MI:SS') and to\_date('20/09/2017  00:01:00','DD/MM/YYYY HH24:MI:SS')

   and session\_type \<> 'BACKGROUND'

group by

   sql\_id

order by

   count(\*) desc)
where
rownum \<=10;
The same with the ASH report. It does not show 5pzs61bncrrkv in TOP sql with top events
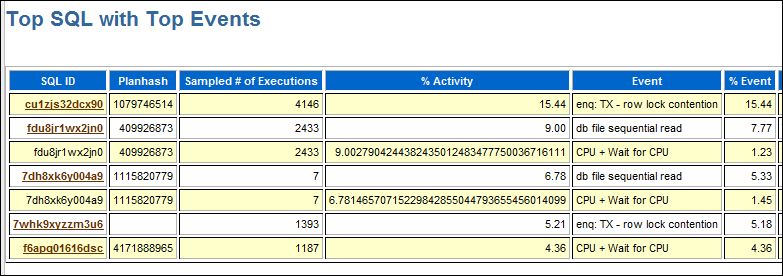
But it appears in TOP PL/SQL Procedures of the ASH report !!!!
I'm wondering if because the fact that 5pzs61bncrrkv is a PL/SQL call is treated in a different way and is not listed in the ASH sql area nor in the query from dba_hist_active_sess_history.
Anyone have a clue ?
Or a different query to be abbe to reflect the AWR report and list 5pzs61bncrrkv as the top consumer ?
Thank you all