Hello folks.
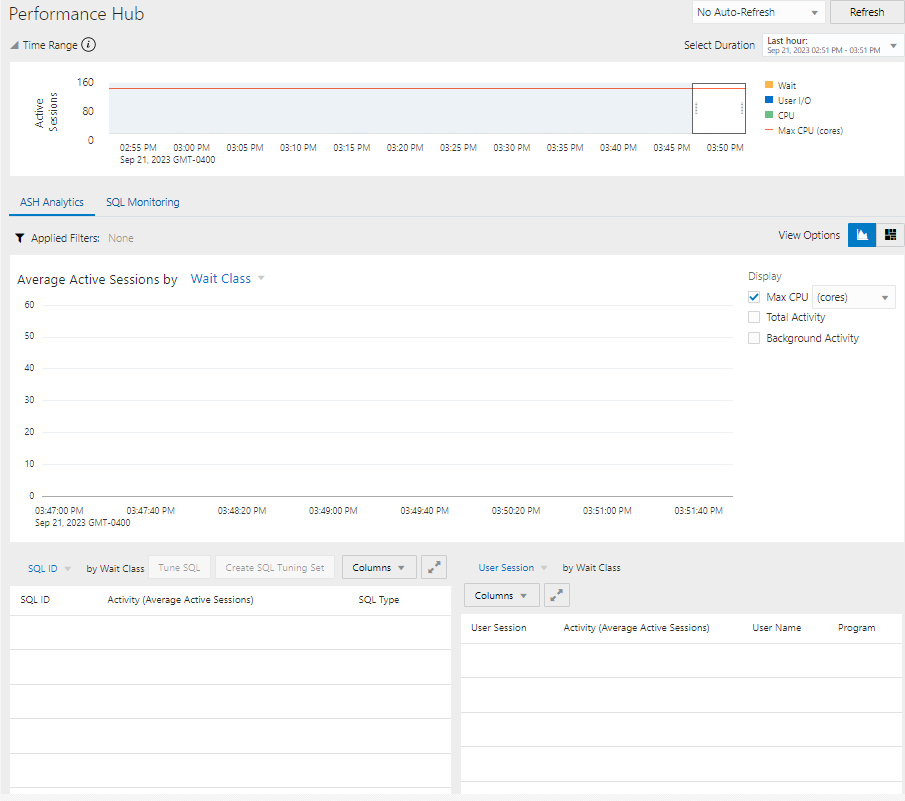
I'm experiencing a weird behavior with the ASH Analytics page on Cloud Control. Basically more often than not it simply does not load any data at all:
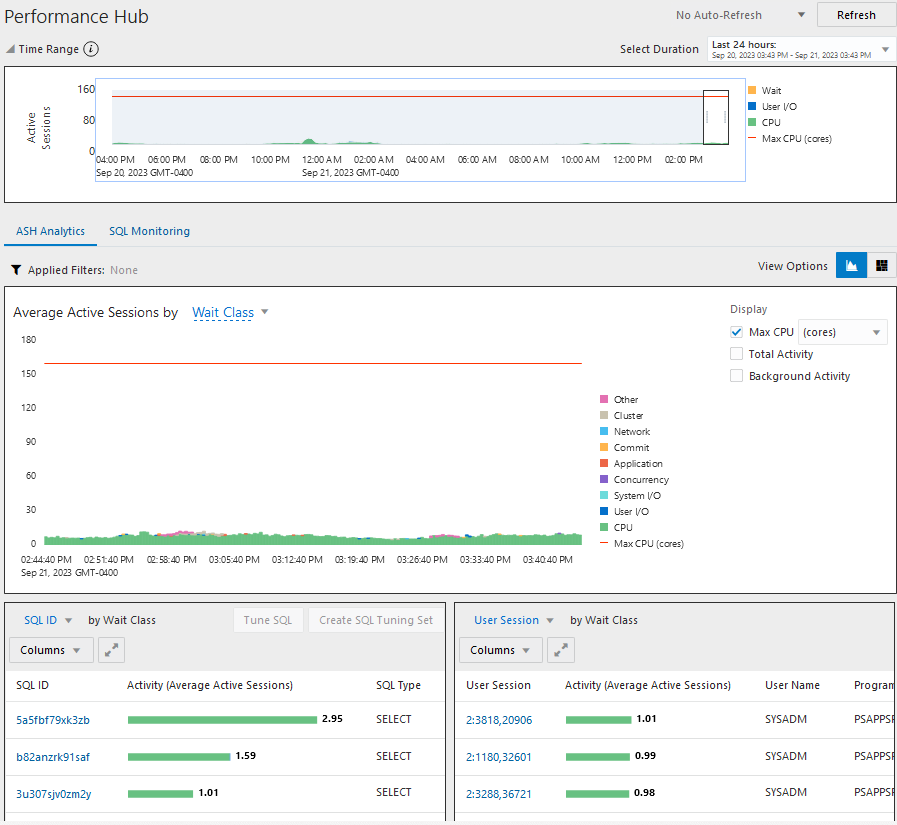
But inexplicably some times it does load the graphs correctly:
I tried every kind of possible scenarios: changing the browser's language (my browser is in french and I'm aware of the old issue with it, changing to english did not help, though), switching from chrome to firefox, using real time and auto refresh VS historic data… Nothing, absolutely nothing changed the behaviour; on each of these setups most of time the graphs were empty but around one out of ten tries it would load correctly.
Giving the page eventually does show data (no matter the language, the browser or the time slice), I cannot determine exactly what is making it fail most of time.
So, anyone ever saw something similar? I tried investigating the logs on the webserver itself and saw few java error stacks, but they were sort of sporadic and didn't seem generated by the issue I'm facing.
Anyone has a guess, maybe?