Hi All,
I have created a new ‘Dashboard’ page. This page generates a couple of ‘sample’ charts, one of them a pie-chart. I have appended the default query used by this chart to add a slice_color field and have set the color to red:
select 'Label 1' label, 30 value , 'red' slice_color from sys.dual
union all
select 'Label 2' label, 20 value, 'red' slice_color from sys.dual
union all
select 'Label 3' label, 34 value, 'red' slice_color from sys.dual
…..
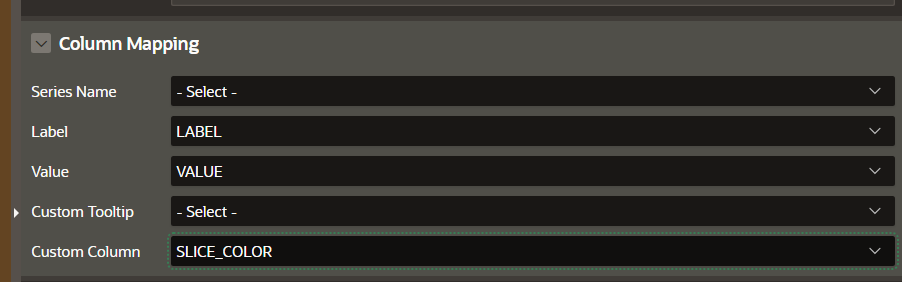
I then assigned the Custom Column to use the slice_color column and expected to see al the ‘slices’ to show in red. But this does not seem to work.
What am I missing or is this a bug?