Hi guys, I wanted to do this with native apex, but I can't, and here on the forum I saw that there are some posts about oracle jet, I'm trying to do it but it's not working, can you help me.
I have a query that will return:
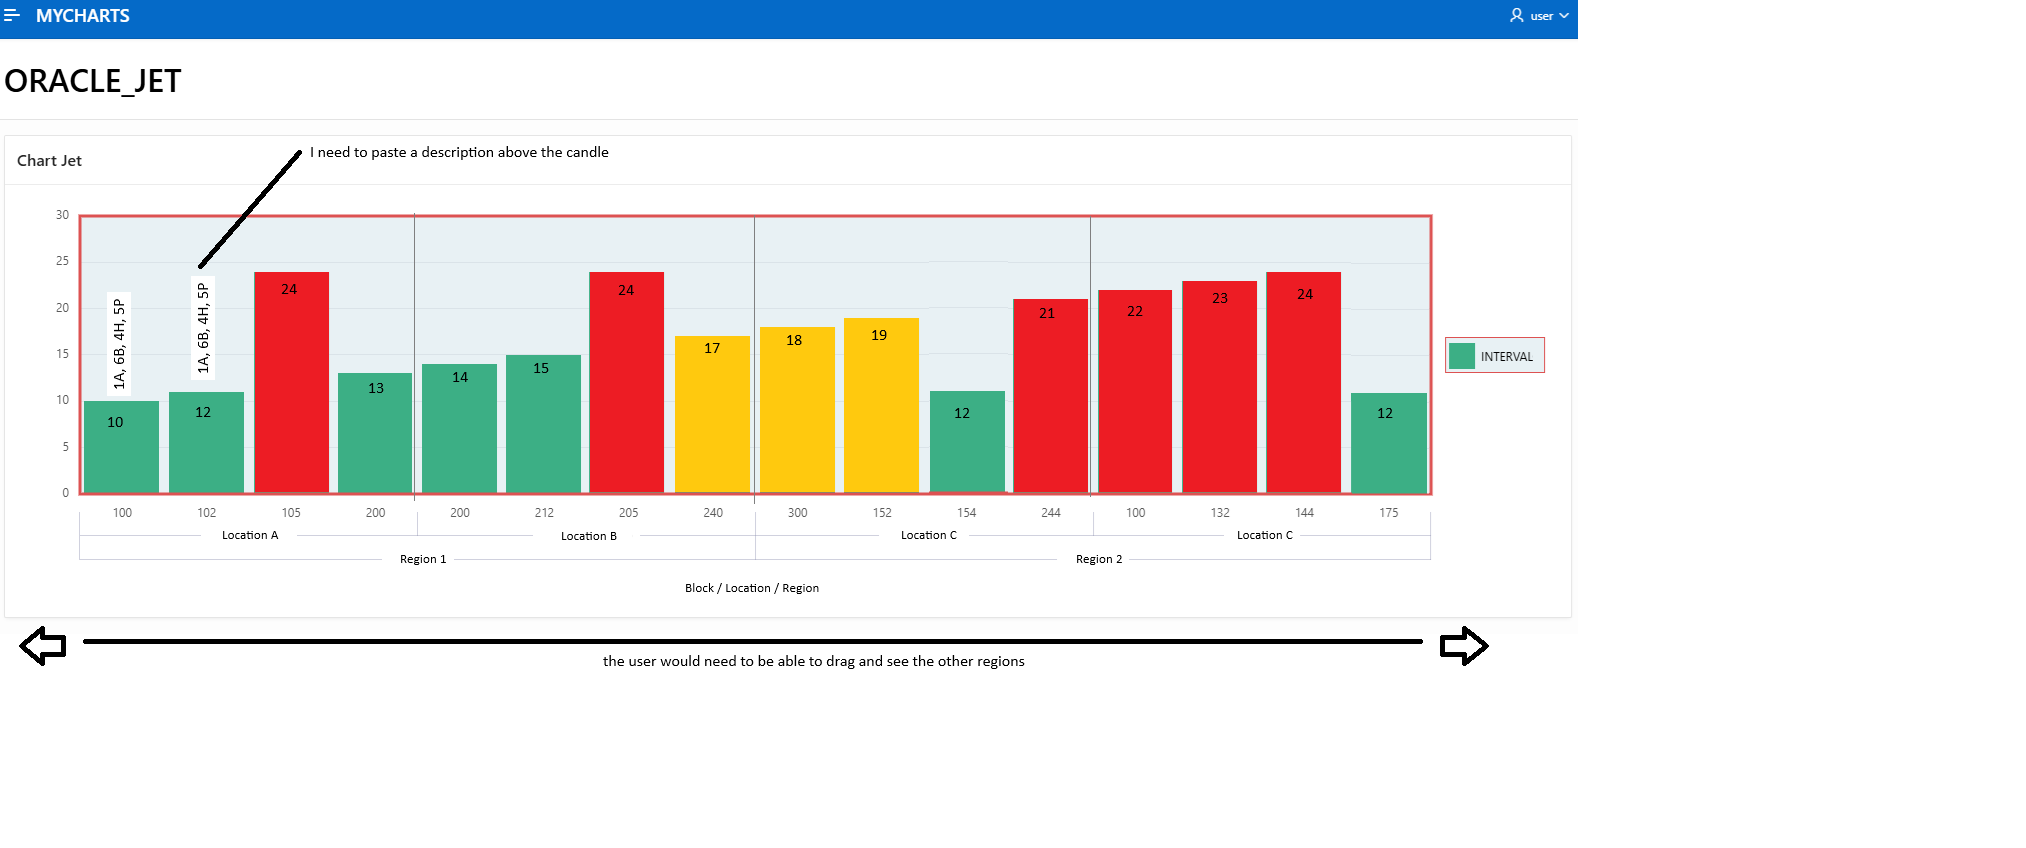
select region, location, block, interval_day from tbl_app
I need to create a chart to show the blocks by location and region, and depending on the interval the candle has to be a different color. I managed to do it with native Apex, but always showing only one location at a time. I need to show everything at the same time, where the user can navigate through all the regions and locations as shown in the image above. I've seen examples where the chart has a scroll bar, I need to do the same. I also need to add vertical text above each candle; this text can change with each candle.
I also couldn't change the color of the bar in the same series of the graph depending on the interval_day, is this possible?
I would be immensely grateful to anyone who can help.