Hi, I've been using oracle for the last 20 years and would not use any other. I've dabbled in forms from 1.1 to 10.
So the time has come that I need to understand and use Apex 5.1 as I want to build a visualisation.
I've worked out how to build a simple screen with a region and a line chart and a few buttons and dynamic actions.
However of the charts I have seen in the Jet cookbook, the timeline would be the most useful and impressive.
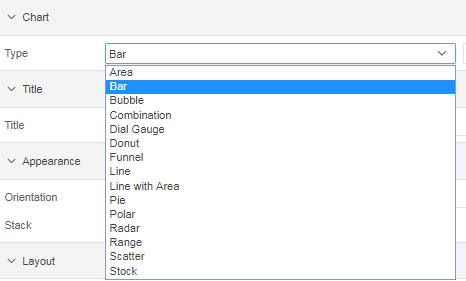
So I setup a region type "chart" then go to the region attributes and press the lov and no timeline option in the drop down ?
Any tips as to what I need to do to create a timeline chart?
I'd also like to try out "tag cloud" and sunburst these are also omitted from the list of values, I've spent days googling this and have searched the forum today.
Joy of joys I did find a post with a working timeline but without access to the apex page designer I couldn't see how it was done.
Many thanks for your time.