Hello Team,
I've recently been testing the metaspace with an application that uses Derby DB making some lookup table tasks, load an amount of classes and then perform unload of those. We did a performance test, where we tested this behaviour with different JDK versions i.e. JDK 7 and 8 and loading / unloading ~20K classes.
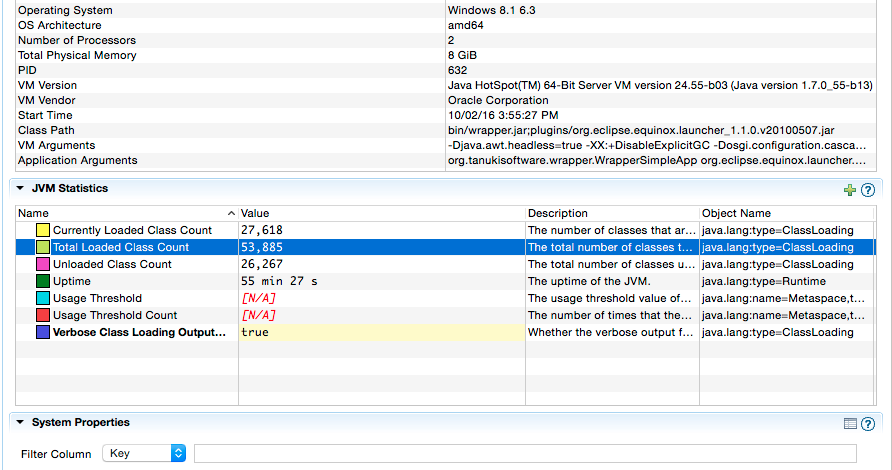
JDK 7
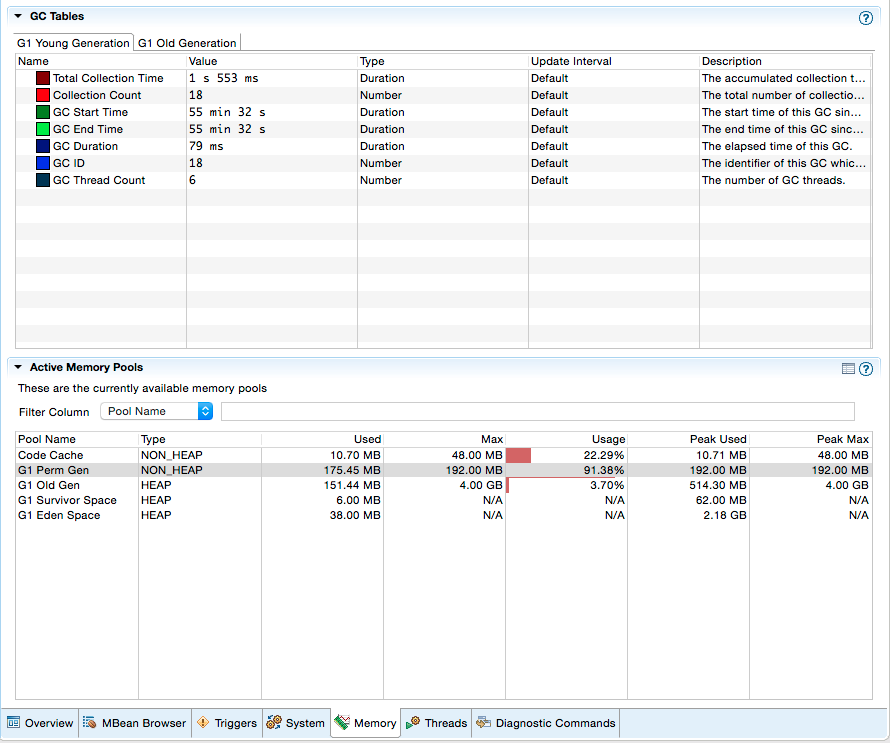
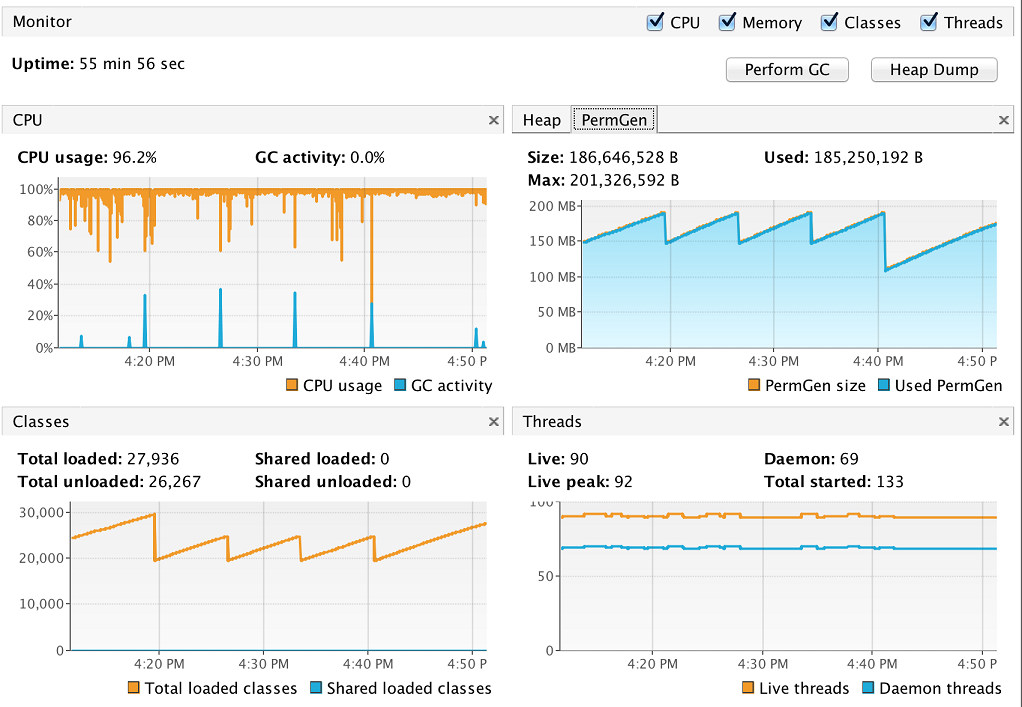
In JDK 7 the PermGen is able to unload the classes and shrink the PermGen space when performing GCs, and the JVM was responsive. This is with max Perm Size of 192m.
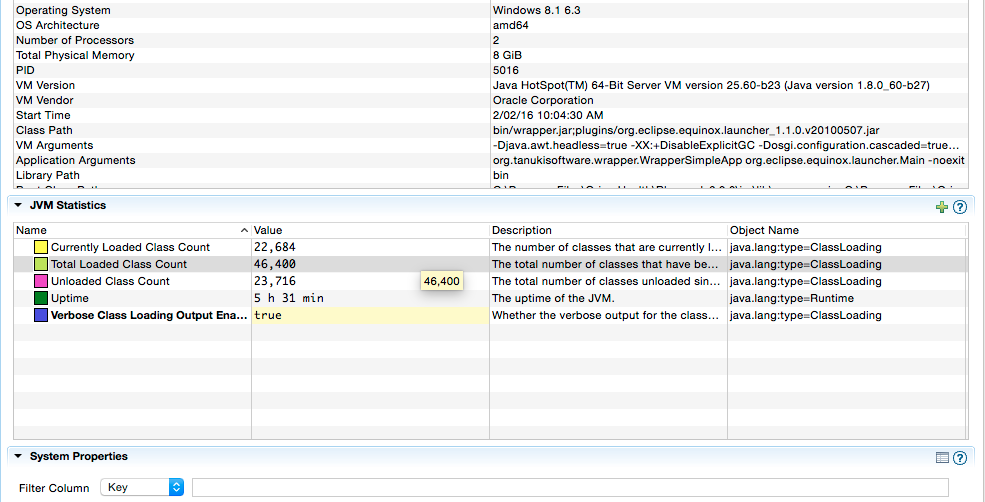
JDK 8
In JDK 8u60 to u74 we've been testing the behaviour with different maxMetaspace sizes and metaspacesize flags. The behaviour that I'm perceiving is that at the beginning the JVM is able to shrink the Metaspace size, but later the JVM becomes unresponsive (like a zombie) making a lot of Full GCs due to metaspace threshold events. It takes a lot of time to end up in OOM: Metaspace or sometimes is not able to end up into OOM, but the unresponsiveness is there for a lot of time.
The following settings were used:
-XX:MaxMetaspaceSize=256m
Initial and Max heap = 4096
or
-XX:MaxMetaspaceSize=1024m
Initial and Max heap = 4096
The behaviour can be seen in the logs like:
2016/02/12 16:03:38 | [GC pause (G1 Evacuation Pause) (young) 204M->31M(4096M), 0.0459586 secs]
2016/02/12 16:03:38 | [GC pause (G1 Evacuation Pause) (young) 209M->32M(4096M), 0.0310936 secs]
2016/02/12 16:03:58 | [GC pause (G1 Evacuation Pause) (young) 228M->56M(4096M), 0.0416175 secs]
2016/02/12 16:04:18 | [GC pause (G1 Evacuation Pause) (young) 234M->69M(4096M), 0.0525407 secs]
2016/02/12 16:04:23 | [GC pause (G1 Evacuation Pause) (young) 247M->94M(4096M), 0.0734999 secs]
2016/02/12 16:04:25 | [GC pause (G1 Evacuation Pause) (young) 272M->106M(4096M), 0.0456418 secs]
2016/02/12 16:04:28 | [GC pause (G1 Evacuation Pause) (young) 284M->159M(4096M), 0.0823508 secs]
2016/02/12 16:04:33 | [GC pause (G1 Evacuation Pause) (young) 337M->172M(4096M), 0.0441538 secs]
2016/02/12 16:04:34 | [GC pause (G1 Evacuation Pause) (young) 362M->171M(4096M), 0.0182898 secs]
2016/02/12 16:04:35 | [GC pause (G1 Evacuation Pause) (young) 409M->168M(4096M), 0.0121343 secs]
2016/02/12 16:04:49 | [GC pause (G1 Evacuation Pause) (young) 2614M->182M(4096M), 0.0476709 secs]
2016/02/12 16:06:16 | [GC pause (G1 Evacuation Pause) (young) 2705M->220M(4096M), 0.1017099 secs]
2016/02/12 16:09:16 | [GC pause (Metadata GC Threshold) (young) (initial-mark) 1200M->221M(4096M), 0.1429006 secs]
...
...
2016/02/12 16:09:16 | [Full GC (Metadata GC Threshold) [GC concurrent-root-region-scan-start]
2016/02/12 16:13:07 | [Full GC (Metadata GC Threshold) [GC concurrent-root-region-scan-end, 0.0004524 secs]
2016/02/12 16:16:55 | [Full GC (Metadata GC Threshold) [GC concurrent-root-region-scan-start]
2016/02/12 16:18:21 | [Full GC (Metadata GC Threshold) [GC concurrent-root-region-scan-start]
2016/02/12 16:18:22 | [Full GC (Metadata GC Threshold) 148M->148M(4096M), 0.3452918 secs]
2016/02/12 16:18:53 | [Full GC (Metadata GC Threshold) [GC concurrent-root-region-scan-start]
2016/02/12 16:18:54 | [Full GC (Metadata GC Threshold) [GC concurrent-root-region-scan-start]
2016/02/12 16:18:54 | [Full GC (Metadata GC Threshold) [GC concurrent-root-region-scan-start]
2016/02/12 16:18:55 | [Full GC (Metadata GC Threshold) [GC concurrent-root-region-scan-start]
2016/02/12 16:18:56 | [Full GC (Metadata GC Threshold) [GC concurrent-root-region-scan-start]
2016/02/12 16:18:57 | [Full GC (Metadata GC Threshold) [GC concurrent-root-region-scan-start]
2016/02/12 16:18:57 | [Full GC (Metadata GC Threshold) [GC concurrent-root-region-scan-start]
2016/02/12 16:18:58 | [Full GC (Metadata GC Threshold) [GC concurrent-root-region-scan-start]
2016/02/12 16:18:59 | [Full GC (Metadata GC Threshold) [GC concurrent-root-region-scan-start]
2016/02/12 16:18:59 | [Full GC (Metadata GC Threshold) [GC concurrent-root-region-scan-start]
2016/02/12 16:19:00 | [Full GC (Metadata GC Threshold) [GC concurrent-root-region-scan-end, 0.0000925 secs]
2016/02/12 16:19:01 | [Full GC (Metadata GC Threshold) [GC concurrent-root-region-scan-end, 0.0001064 secs]
2016/02/12 16:19:02 | [Full GC (Metadata GC Threshold) [GC concurrent-root-region-scan-start]
2016/02/12 16:19:02 | [Full GC (Metadata GC Threshold) [GC concurrent-root-region-scan-start]
2016/02/12 16:19:03 | [Full GC (Metadata GC Threshold) 138M->138M(4096M), 0.3650801 secs]
2016/02/12 16:19:04 | [Full GC (Metadata GC Threshold) [GC concurrent-root-region-scan-start]
...
...
2016/02/12 16:28:22 | [Full GC (Metadata GC Threshold) [GC concurrent-root-region-scan-start]
2016/02/12 16:28:22 | [GC concurrent-root-region-scan-end, 0.0000757 secs]
2016/02/12 16:28:22 | [GC concurrent-mark-start]
2016/02/12 16:28:22 | 146M->146M(4096M), 0.4709645 secs]
2016/02/12 16:28:23 | [Full GC (Last ditch collection) 146M->146M(4096M), 0.4344884 secs]
2016/02/12 16:28:23 | [GC concurrent-mark-abort]
2016/02/12 16:28:23 | [GC pause (Metadata GC Threshold) (young) (initial-mark) 147M->146M(4096M), 0.0070508 secs]
2016/02/12 16:28:23 | [Full GC (Metadata GC Threshold) [GC concurrent-root-region-scan-start]
2016/02/12 16:28:23 | [GC concurrent-root-region-scan-end, 0.0001413 secs]
2016/02/12 16:28:23 | [GC concurrent-mark-start]
2016/02/12 16:28:23 | 146M->146M(4096M), 0.4108458 secs]
2016/02/12 16:28:24 | [Full GC (Last ditch collection) 146M->146M(4096M), 0.4204594 secs]
2016/02/12 16:28:24 | [GC concurrent-mark-abort]
2016/02/12 16:28:24 | [GC pause (Metadata GC Threshold) (young) (initial-mark) 146M->146M(4096M), 0.0065397 secs]
2016/02/12 16:28:24 | [Full GC (Metadata GC Threshold) [GC concurrent-root-region-scan-start]
2016/02/12 16:28:24 | [GC concurrent-root-region-scan-end, 0.0000440 secs]
2016/02/12 16:28:24 | [GC concurrent-mark-start]
2016/02/12 16:28:24 | 146M->146M(4096M), 0.3809647 secs]
Shutdown failed: Timed out waiting for the JVM to terminate.
Dumping JVM state.
Heap
garbage-first heap total 4194304K, used 149826K [0x00000006c0000000, 0x00000006c0204000, 0x00000007c0000000)
region size 2048K, 1 young (2048K), 0 survivors (0K)
Metaspace used 125296K, capacity 139898K, committed 262144K, reserved 1189888K
class space used 14994K, capacity 21204K, committed 121216K, reserved 1048576K
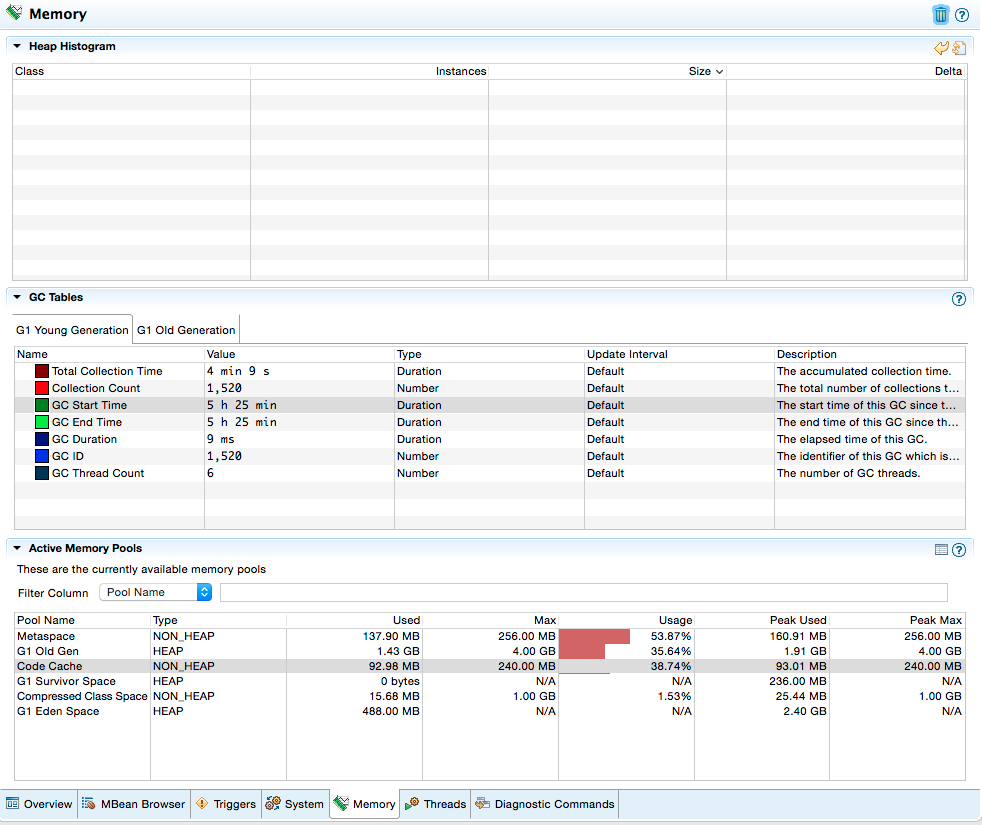
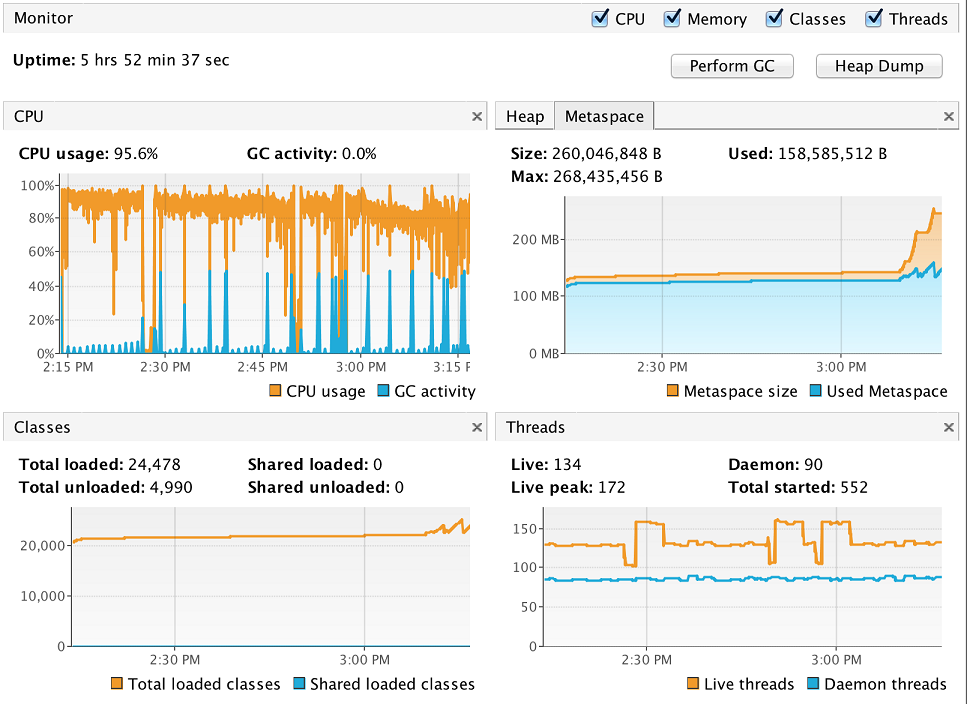
If I use an initial high water mark, metaspacesize=128m for example, I'm seeing the same behaviour. The following pictures show the behaviour with the settings:
-XX:MaxMetaspaceSize=256m, Initial and Max heap = 4096.
Therefore, the question is:
Is this a potential bug that makes the JVM unresponsive compared to PermGen from JDK7 or is it working as designed?
Thank you,
Alexis V.