Hi all,
I'm working on a mock-up dashboard to show the powerfulness of APEX in comparison with some third party software that we are paying $$$ for using. I've become a bit stuck in trying to achieve this requirement but hopefully it's not too far out of the norm.
I have a donut chart, I want to have the total value of all the pieces displayed in the center. It took me a while to work out how to display anything in the center, but I found this thread APEX 5.1 Jet Chart: Donut Chart Center Label which cleared that part up and helped me understood what I was looking at with the documentation a little better.
I'm using the demo charts packaged application as a quick proving ground, more precisely I'm using the "Donut Chart (Custom Labels via JavaScript Customization)" on the Pie page. There is already custom JS running on this chart that uses references the total value in order to work out the percentage each slice equates to. The problem I'm having is being able to reference that total value else where in my JS in order to use it in the center label. I had a ctrl+f through the ojChart reference https://docs.oracle.com/middleware/jet202/jet/reference-jet/oj.ojChart.html#pieCenter.label but it seems like the only part that is aware of the total value is in an object passed into the datalabel function, I don't know how I would get this to return a value to my options.pieCenter.
I can just reference a hidden value in my page that's populated by the sum of the values, but that means doing the work of the chart query twice (ish), and if I hide values by clicking on the legend, the value won't be recalculated.
Hopefully the code helps to show what I meant, this is just from modifying the sample chart packaged app. My current JS is:
function( options ){
this.pieSliceLabel = function(dataContext){
var series_name,
percent = Math.round(dataContext.value/dataContext.totalValue*100);
    if ( dataContext.seriesData ) {
        series\_name = dataContext.seriesData.name;
    } else {
        series\_name = 'Other';
    }
    return series\_name + " " + percent + "% ( " + dataContext.value + " )";
}
// Set chart initialization options
options.dataLabel = pieSliceLabel;

options.pieCenter = {
            label: "Total :" + $x("P4\_NEW").value // I want this to show the dataContext.totalValue that's being sent to my dataLabel function
}
return options;
}
p4_new is a hidden item derived by the query:
select sum(a.cost) value
from eba_demo_chart_tasks a,
eba\_demo\_chart\_projects b
where a.project = b.id
This produces (when a few of the legend items are hidden):
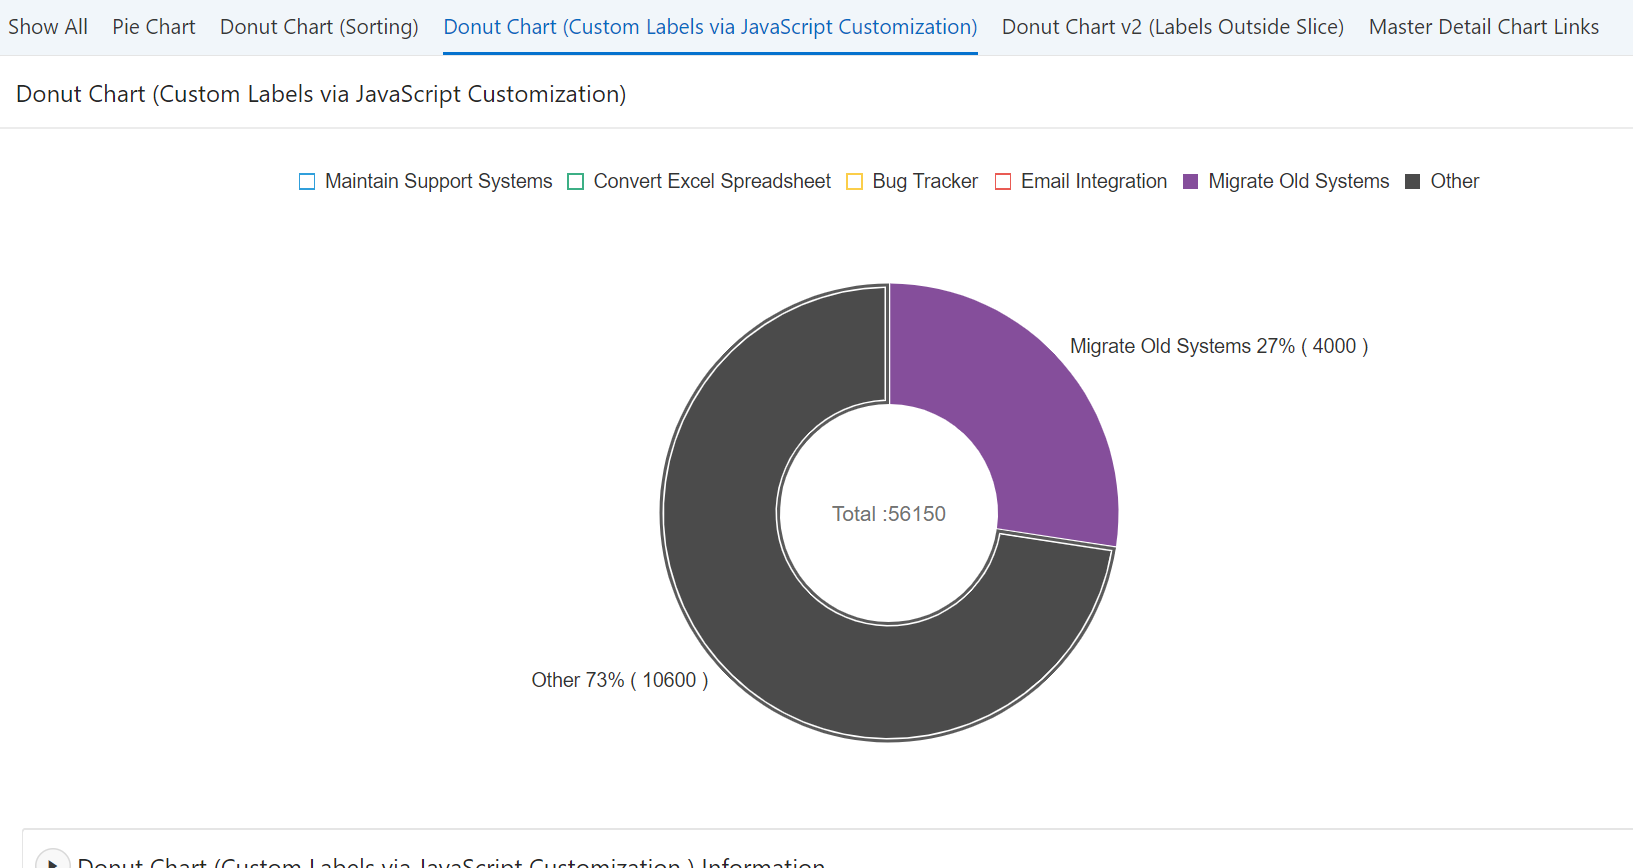
I want the center label to display "Total: 14600" (10600+4000)
Let me know if I could provide any more detail.