Hello, experts
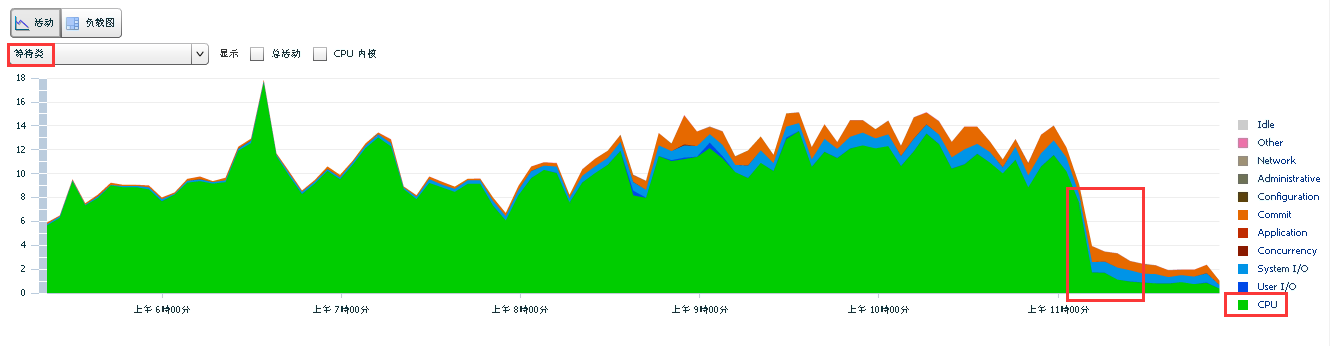
Today I found a SQL is running and consuming a lot of CPU resource on my Oracle Database Server 11.2.0.4.0 for Linux x86_64. Next I observed some historical ASH data.
The following are my 4 number of screenshots,

At the same time I had also queried the view "v$active_session_history",
set linesize 200
set pagesize 200
col event for a40
select *
from
( select sql_id
    , event

    , count(\*)
from v$active_session_history
where sample_time between to_date('2018-06-28 06:00:00','yyyy-mm-dd hh24:mi:ss')
and to_date('2018-06-28 11:10:00','yyyy-mm-dd hh24:mi:ss')
group by sql_id
, event
order by count(*) desc
       , event

       , sql\_id
)
where rownum <= 20
;
SQL_ID EVENT COUNT(*)
-------------------------- ---------------------------------------- ----------
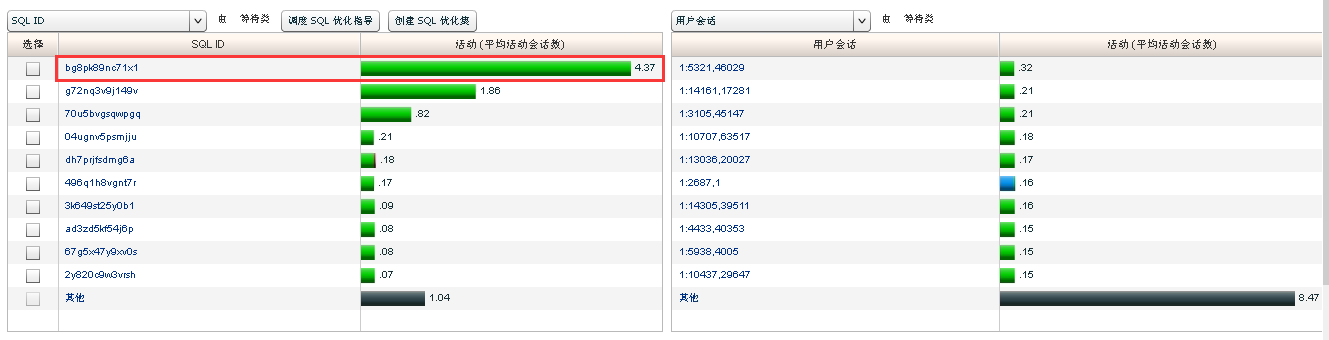
bg8pk89nc71x1 97131 <<==
g72nq3v9j149v 43149
70u5bvgsqwpgq 13501
                       log file sync                                 11754

                       db file async I/O submit                       7057
04ugnv5psmjju 5023
496q1h8vgnt7r 3962
dh7prjfsdmg6a 3467
                                                                      3181

                       log file parallel write                        2909
3k649st25y0b1 1932
67g5x47y9xv0s 1505
0mbyvszuyd6s2 1383
ad3zd5kf54j6p 1294
2y820c9w3vrsh 1291
520mkxqpf15q8 1238
dkx64pv90vtx9 1079
dktwkccxpm7u4 778
d8z4mmrtbj6aq 741
7kmr0ddt2pd0h 684
20 rows selected.
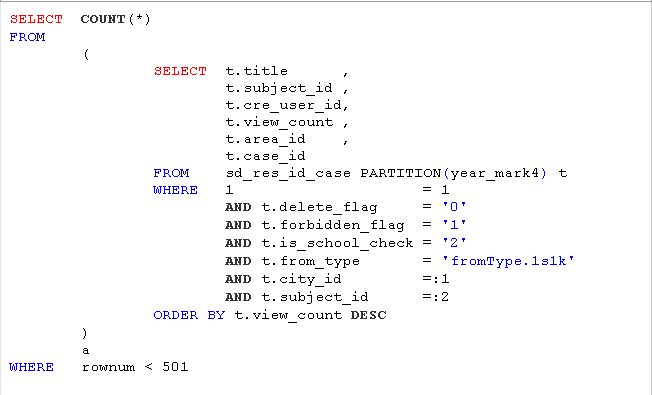
Afterwards I used SQLT tool to export this SQL_ID ("bg8pk89nc71x1")'s SQLT reports, there are some screenshots as follows,
(1) SQLT main page,

(2) when I click "STA Report" on the part of "SQL Tuning Advisor" based on the first picture above, then appear the second picture below,
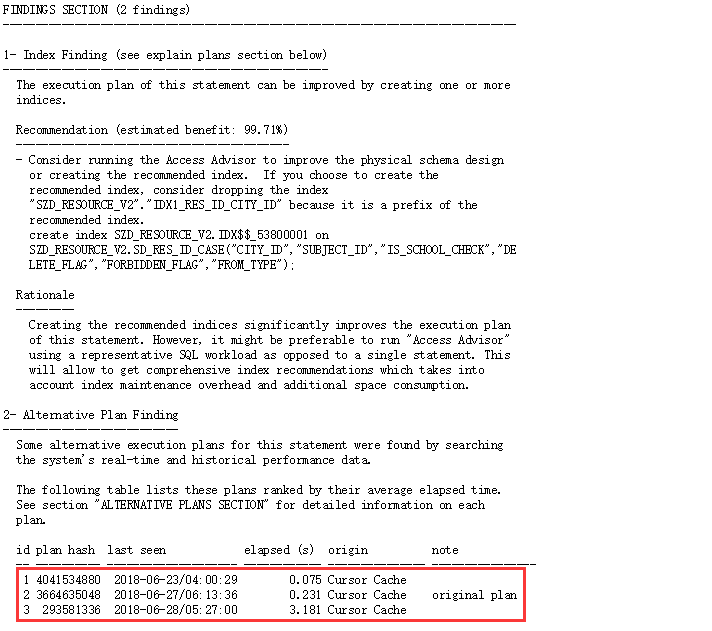
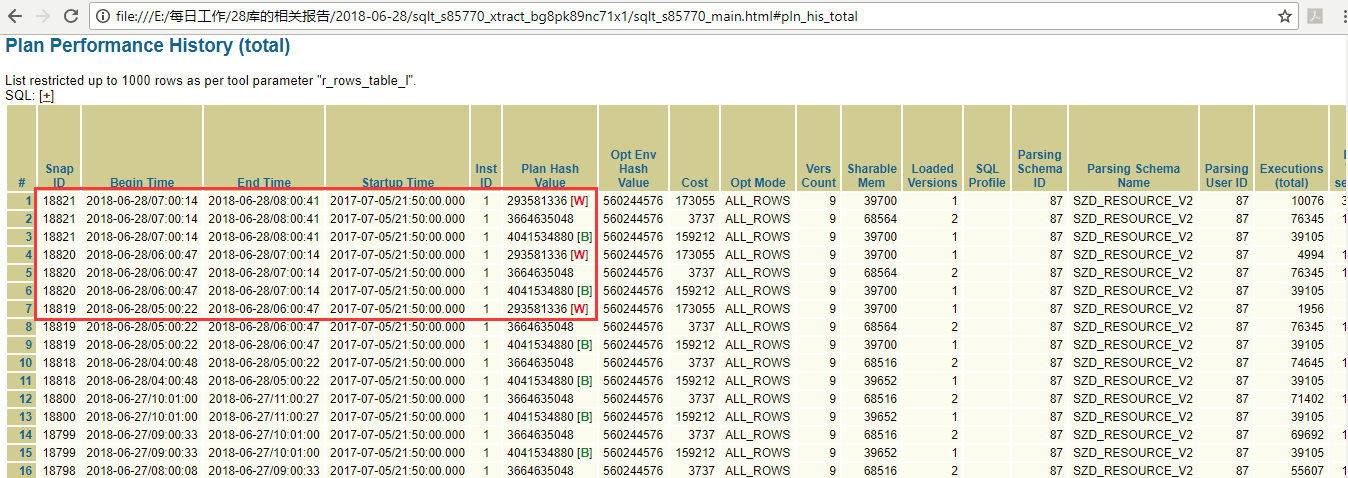
(3) according to the first picture on SQLT, I click the "Performance History (total)" on the part of "Plans", then show the third picture as follows,
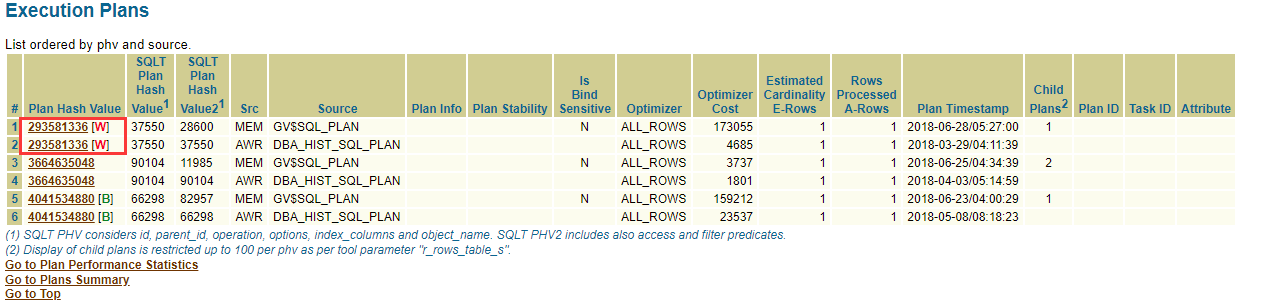
(4) when I click the "Execution Plans" on the part of "Plans", then present the fourth screenshot below,
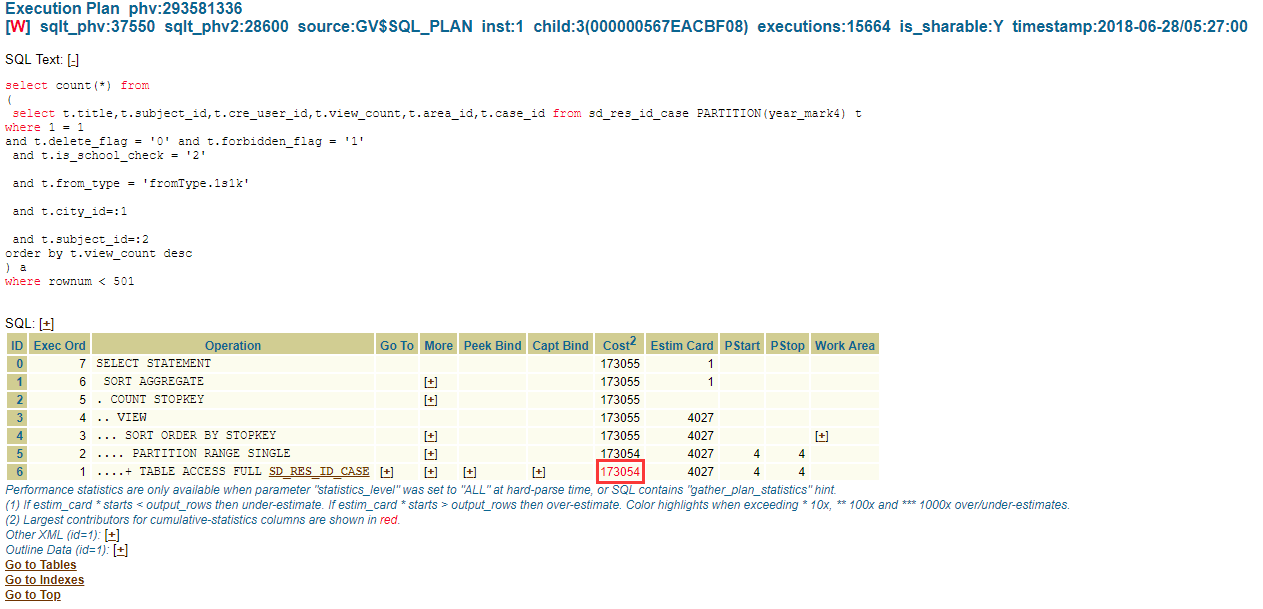
(5) based on the fourth picture above, I click the hyper link for the first plan hash value - "293581336 [****W]", then jump to the fifth image as follows,
Next, how to continuously analyze this issue?
Please giving me some good advice, very appreciate you if any help.
Best Regards
Quanwen Zhao